Blogs & News
A Day in the Life of a Collaborative Data Science platform
I’ve been working with diverse data sets for the last four months using Aridhia’s collaborative data science platform, AnalytiXagility.
This week the platform took centre stage at the Greater Manchester Data Dive, when it was deployed to support 45 analysts and coders, 6 teams, 15 mentors, 20 data sets and 3 judges to compete and test the boundaries of what could be yielded from open data sets.
Hosted by the University of Manchester’s Informatics Centre and held at MediaCityUK, the data dive aimed to demonstrate the insights that could be gained from data analytics by collaborating in teams.
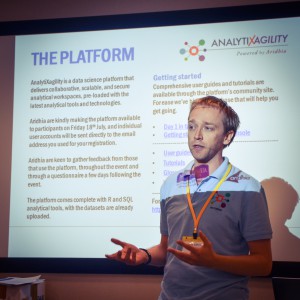
Andy Judson, Director of Data Science, introducing AnalytiXagility
Andy, Nigel, Sophie, from our in-house Data Science Team, and I travelled down to Manchester ahead of the event, for a tour of the facilities at The Landing, Media City UK and to discuss the logistics with Matt and Ruth from the University of Manchester. It’s fair to say that no one knew what to expect
However, the participants were amazed at the breadth of data available and the ease with which they could browse it within AnalytiXagility. 45 users were simultaneously using the platform within half an hour of arriving. Even groups who used their own tools said that it was invaluable for seeing what was available and how the various data sets linked together.
As expected there were many questions about getting data in and out of the platform, along with usual requests for very specific tools, but overall people we’re keen to use the platform to do their analysis and visualisation – even if it meant using tools they were unfamiliar with. Fortunately, we were able to help with the majority of requests. Thanks to the cloud nature of the platform, Sophie and Kenny from our support team, were able to upload requested datasets including one containing information on every registered business in the UK (which as you can imagine were pretty large!).
Of course, when given the choice between ‘traditional’ bar plots and line charts, and the ability to plot geographical data on a map, everybody decided (probably correctly given the data we provided) that geographical heat maps and choropleth maps were the way to go, which kept myself and Annie (working remotely from our office in Edinburgh) very busy, creating examples and showing how this could be achieved using the R console within the platform.
As with many hackathon type events most of the teams had to reel in their ambitious plans for something more achievable in the 6 hour timeslot. In fact, people wanted to know whether they would have access to the platform for a few days after the event, obviously keen to continue their investigations. Nonetheless, every team managed to produce some interesting results by the end of the day which were presented to be judged by Prof. Andy Brass from the University of Manchester, Steve Turner from Future Cities at Manchester City Council, and our very own Andy Judson, Director of Data Science at Aridhia.
So, as well as being a successful hackathon, it was also an excellent test of the platform’s user experience as we had so many people using AnalytiXagility simultaneously. As a result we have plenty of useful feedback and observations of how people used the platform throughout the day. A prize for the bravest user goes to the chap that was using a 10″ monitor, in a single tab on IE!
Here’s some local press coverage of the event.
Keep an eye out on our Twitter feed and LinkedIn page for details of future events.