Blogs & News
Risk Stratification and Hospital Readmission Rates
Summary
Hospital readmission rates are often used as a proxy measure of how effectively healthcare is being delivered within a population. Targeting interventions at individuals at risk of readmission to hospital has the potential to prevent ill health whilst reducing healthcare costs.
Risk stratification within healthcare systems is the process by which validated mathematical models are used to identify specific populations of interest in an effort to improve the delivery of healthcare.
Various risk stratification models aimed at identifying individuals at risk of hospital readmission have been developed, using data derived from different patient populations. Aridhia has developed an effective tool that allows users to apply a model that is relevant to the local context and tailor output to their requirements whilst ensuring good information governance practices are adhered to.
Background
The Francis report1 recommendations stressed that an “electronic patient information system should have the facility to collect performance management and audit data automatically;…[be] designed in partnership between health professionals and patient groups; and have the capability to go over and above nationally required minimum standards.”
One such set of standards is the NHS Outcomes Framework which comprises a set of national goals stratified within five domains, one of which is capturing effectiveness2. Effectiveness is defined as an organisation’s ability to “help… people to recover from episodes of ill health or following injury”. A proxy measure of effectiveness currently used is the rate of emergency readmissions to hospital within 28 days of discharge from that hospital. Some have questioned the appropriateness of this as a performance indicator because other factors unrelated to the quality of care can affect the probability of readmission.
Irrespective of how quality is measured, identifying potentially modifiable predictors of ill health is an important first step in designing any interventions aimed at the primary or secondary prevention of ill health.
Hospital Readmissions
UK
Hospital Episode statistics provide open source data and annual reports that summarise hospital readmission rates in the UK3. From these data it can be observed that:
- There are approximately 100,000 emergency admissions per week to hospitals in NHS England.
- Between 2002 and 2012, the rate of all emergency readmissions rose from 9% to 11.5% – equivalent to a rise of 27%. Readmission rates are higher in the elderly.
- There was little evidence for an association between decreasing length of stay and higher rates of readmission.
International
Readmission rates are collected throughout the developed world; however, comparisons between these sets of data are difficult owing to the heterogeneity in methods of data collection. For example:
- The USA does not generally distinguish between planned and unplanned admissions, so calculated readmission rates include both. This limits the generalisability of US-based health economic analyses to a UK setting.
- In Australia, readmission rates are generally accepted as a monitoring rather than a performance indicator. Currently, the data linkage capability that is required to measure readmission rates is limited to New South Wales and Western Australia.
- In Europe, the Netherlands use the calculated rate of avoidable admissions – as opposed to readmissions – as a proxy for measuring quality in primary care.
Avoidance of hospital readmission has the potential to reduce both direct and indirect costs. In England, it has been estimated that each hospital readmission costs a trust approximately £2200 and that approximately 15% of readmissions are avoidable4. In addition, NHS trusts are also financially rewarded for lowering readmission rates via a government initiative that aims to improve performance by increasing collaboration between commissioners and providers of services. This policy has proved controversial, because of the concerns that readmission rates are too crude a measure of effectiveness.
Identifying Patients at Risk – Risk Stratification
Risk stratification is the process by which mathematical models are applied to routinely-collected clinical data in an effort to identify patients at high risk of readmission. By applying risk stratification techniques, clinicians can then target resources to specific individuals or groups in the hope that future ill health (and hence hospital readmission) is prevented. The model provides the clinician with a score and the individual is deemed to be at “high risk” if their score reaches a certain threshold. The success of this approach is therefore determined by both the choice of model and the chosen threshold.
There are a number of predictive risk models available, each of which aims to identify individuals at risk of an unplanned hospital admission. These models have been developed using statistical techniques (such as multiple regression), but they vary in terms of the time period for which they predict, and the source and type of routine data used. Models derived from UK data include:
- the Patients At Risk of Readmission within 30 days (PARR-30)5
- the Scottish Patients at Risk of Readmission and Admission (SPARRA) version 36
- the Predicting Emergency Admissions Over the Next Year (PEONY7 and PEONY II)
- the Predictive Risk Stratification Model (PRISM).
Similar models have been developed outwith the UK, for example, the Canadian LACE model (based on length of stay, acuity of illness, co-morbidities and emergency department visits)8. There are many similarities between these various models as illustrated in the table below:
| Model | Prediction | Population | Age | Predictors | c-statistic |
|---|---|---|---|---|---|
| PARR-30 | Risk of readmission within the next 30 days | Currently in hospital | All ages | NHS organisation Age Socioeconomic status Co-morbidities Emergency admissions |
0.70 |
| SPARRA v3 | Risk of emergency admission within the next year | Irrespective of previous hospital admissions | >16 years | Age Socioeconomic status Specific drug therapies Hospital inpatient admissions Psychiatric admissions Emergency dept admissions Outpatient visits |
0.68 (SPARRA v1) |
| PEONY II | Risk of emergency admission within the next year | Irrespective of previous hospital admissions | 40 years | Age Gender Socioeconomic status Smoking and Alcohol status Specific drug therapies Co-morbidities |
0.74 |
| PRISM | Risk of emergency admission within the next year | Irrespective of previous hospital admissions | All ages | Age Gender Socioeconomic status Smoking status Co-morbidities Specific drug therapies Inpatient admissions Outpatient visits |
– |
| LACE | Risk of early death or readmission to hospital within the next 30 days | Currently in hospital | All adults | Length of hospital stay Acuity of illness Co-morbidity score Emergency dept use |
0.68 |
The chosen model must then be incorporated into a bespoke software platform to provide clinicians and commissioners with a predictive tool that can be applied to their patient population. These users can then tailor the output from this tool in accordance with their individual needs.
Aridhia’s Risk Stratification Tool
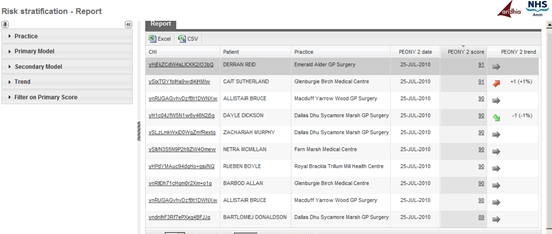
Aridhia’s risk stratification tool provides an interactive web-based front-end to identify patients at risk of readmission. The generic framework can be configured to incorporate any number of predictive models as and when they are developed or refined. The tool is currently being used in NHS Tayside and NHS Grampian (NHS Scotland boards) and utilises both PEONY II and SPARRA to calculate a portfolio of risk scores per patient using near real-time data (see figure).
Aridhia’s use of existing infrastructure integrates data feeds from both primary and secondary care whilst ensuring that no data leaves the NHS network, except as required for developing the scoring and delivery to GP practices.
How Good are the Models?
As previously mentioned, risk stratification models provide users (that is, clinicians and commissioners) with a score that is a measure of risk. Users must still decide which patients are at “high risk” by identifying a suitable threshold for this score. Patients who have a score above this threshold are those that could potentially benefit from some sort of intervention to mitigate that risk.
There are a number of ways in which the accuracy of a risk stratification model can be assessed. These include measures such as positive predictive value, sensitivity and specificity – all of which vary depending on the threshold agreed upon. A low threshold will identify a lot of “high risk” patients, many of whom will not actually end up in hospital (highly sensitive but not very specific) and vice versa. Sensitivity and specificity can be combined into a single measure called the c-statistic, with a maximum value of 1. It is outwith the scope of this post to discuss how all these various measures are calculated, but the c-statistic is included in the table above to allow comparison between the models (the bigger the number the better). Most models have a c-statistic around 0.6-0.7.
Conclusion
Risk stratification provides healthcare organisations with a way to utilise pre-existing, routinely collected data in a way that has the potential to effectively target resources to individuals at risk of developing illness. An effective tool should allow users within healthcare organisations to tailor the stratification process by choosing the appropriate model and thresholds that are relevant to their population. By doing so, risk stratification has the potential to improve organisational effectiveness; reduce costs; and prevent avoidable illness.
References
- Francis R. Report of the Mid Staffordshire NHS Foundation Trust Public Inquiry [Internet]. 2013.
- Department of Health. NHS Outcomes Framework 2013 to 2014 [Internet]. 2012 [cited 2014 Feb 19].
- NHS Information Centre for Health and Social Care. Hospital Episode Statistics: Emergency readmissions to hospital within 28 days of discharge [Internet]. 2013 [cited 2013 Feb 19].
- Department of Health. Payment by Results Guidance for 2011-12. Feb 2011: Gateway Reference 15618).
- Billings J, Blunt I, Steventon A, Georghiou T, Lewis G, Bardsley M. Development of a predictive model to identify inpatients at risk of re-admission within 30 days of discharge (PARR-30). BMJ Open [Internet]. 2012 Jan 30 [cited 2014 Jan 29];2:e001667-.
- NHS Services Scotland. Scottish Patients at Risk of Readmission and Admission (SPARRA). A Report on the Development of SPARRA Version 3 [Internet]. 2011.
- Donnan P, Dorward D. Development and validation of a model for predicting emergency admissions over the next year (PEONY): a UK historical cohort study. Arch. Intern. . [Internet]. 2008 [cited 2014 Feb 5];
- Van Walraven C, Dhalla IA, Bell C, Etchells E, Stiell IG, Zarnke K, et al. Derivation and validation of an index to predict early death or unplanned readmission after discharge from hospital to the community. CMAJ [Internet]. 2010 Apr 6 [cited 2014 Feb 4];182:551-7.