Blogs & News
WELC Data Challenge Day
On 9th September 2014, something very exciting happened in healthcare. AnalytiXagility hosted one of the largest NHS data exploration events to date at the WELC Data Challenge Day. The day was organised by the WELC Care Collaborative Pioneer Programme, UCL Partners and Aridhia Informatics and was held at the Farr Institute in London. It brought together teams of analysts, clinicians and commissioners to explore integrated care and linked data sets from the three boroughs of Waltham Forest, Tower Hamlets and Newham. The data, supplied by the NHS North and East London Commissioning Support Unit, included anonymised patient level data that spanned primary and secondary care for 1.2 million patients over 3 years, which translates into 180 million rows of data. Data included hospital in-patient, out-patient and A&E, as well as open health data.
The aim of the day was to expose this rich dataset to groups of multidisciplinary teams, allowing the experts to ask the questions and derive insights whilst adhering to the strictest information governance (IG) laws within the safety and security of AnalytiXagility. This had never been done before.
View from the engine room
In the weeks that preceded the event, stakeholders across WELC and Aridhia’s Support, IS and Data Science teams carried out extensive IG and data preparation. The sheer size of data that had to be loaded, the location of the event and an impending deadline meant that all the teams had to work together very quickly and efficiently to iron out any issues that arose. It was decided to host the event on the AnalytiXagility UKCloud instance. In preparation for this, Brian from Aridhia’s IS team carried out validation testing and worked with UKCloud to ensure that connections were fast enough to handle the series of complex queries that would be run at any one time on the platform. Ryan Meikle, Information Manager for the NHS North and East London Commissioning Support Unit (CSU), provided the data and was assisted by Allan, Kenny and Martin from Aridhia to load this onto the platform. 
The size of the dataset was a good test of our processes and 22 datasets were loaded in total. Martin highlighted that the main issues faced when attempting to load the data were related encoding and formatting. Several files tripped up at encoding, which can be attributed to how the files were generated.
The files originated from SQL Server databases, and so were probably encoded as Windows CP1252 which maps the EN-dash character to byte sequence 0x96 – this is illegal for UTF-8 and undefined for ISO-8859-1. The IS team fixed the affected files on the SFTP server by transcoding the data from Windows CP1252 encoding to UTF-8 encoding, and then resubmitted the file. Several of the WELC files also had formatting issues when they were first supplied. A common problem with files containing delimited fields is what to do with text fields that contains the delimiter character. The only solution was to regenerate and resubmit the files with fields quoted. However, a couple of files then tripped up over another common problem – quoted text fields that contain the quote character. The solution was to avoid using the quote character altogether by instead selecting a field delimiter that we knew did not appear in any of the text fields – the caret (^) character was chosen. 
On the Thursday before the event, the Aridhia team were informed that the files supplied were incomplete and so an entirely new set of 22 datasets had to be supplied. When the second set of files were generated, the previous encoding and formatting problems were bypassed by including a Table Definition file that could be read in along with each dataset by the ETL mechanism. The reloading of the tables took less than 24 hours. The volume of data meant that isolating and correcting the issues was challenging, however this has helped outline some changes to be made to the current process. The plan on the day was to have 5 teams, each with access to their own team Workspace which contained all the data.
Allan from Support: “We had to clone each workspace under a very tight deadline and using a new provisioning tool, which was untested in a live situation”. Romana from Service Delivery said “I was responsible for accepting the release of AnalytiXagility 1.5 Platform and ensuring it was deployed to UKCloud in advance of the event, giving the Data Science team a chance to use the application. Although there were challenges on the way to deploying this version to UKCloud, the Service was back up and running in time. Some issues were found but working with IS and Product Delivery, we managed to identify workarounds which meant the delivery of the Service was not affected for the WELC event.”
In parallel, Aridhia’s Service Delivery Team upgraded the AnalytiXagility instance on UKCloud to v1.5 while Support cloned the main workspace 5 times.
On the 1.5 release, Lead Developer Finlo stated “Our focus for the release was to make it as solid as possible, with the knowledge that any mistakes were likely to be found in front of a large important audience providing an excellent incentive. Particular attention was paid to improving the user interface and ensuring full compatibility with the browsers that were likely to be used on the day.”
Web Applications Developer Robbie worked on the UI leading up to the WELC day, whose main goal was to get the entire applications UI working in Firefox. “We had never supported that browser up till then, so it was key to iron out any major issues since the WELC data challenge day would use Firefox exclusively.”
View from the front line
Before the Event

With the data loaded, members of the data science team explored the data and ran some preliminary analysis in the few days running up to the event. This included:
- looking at the quality of the data and generating PDF reports for each dataset
- computing the Parr30 risk score for each CCG
- creating a package in R to facilitate the plotting of geographical data
- replicating the analysis provided in the Proposal document:
- Creating subsets of data to be run on the day (e.g. high risk patients only).
The team also sourced open healthcare datasets to enhance those provided by Ryan. The time spent becoming familiar with the data and identifying any nuances that arose proved to be invaluable for the team, especially when working within the short timeframe allocated on the day.
The Data Challenge Day
The session began for the forty attendees and eight data scientists with a brief from Bethan George (Deputy Director Integrated Care, Tower Hamlets CCG), and Andy Judson (Director Data Science, Aridhia), who outlined the main indicators chosen for the program and themes for the day.

Indicators:
- Total bed days for very high and high risk patients
- Emergency admissions
- Avoidable emergency admissions
- Readmissions to hospital within 30 days
Themes:
- Exploring the differences between these indicators across the WELC boroughs in terms of demographics, clinical outcomes
- Comparing the differences between the risk prediction models (one model is used by Tower Hamlets and Newham, a different model used by Waltham Forest) in terms of demographics and clinical outcomes
- What are the opportunities within the next 2-4 years of expanding the program to the moderate risk group?
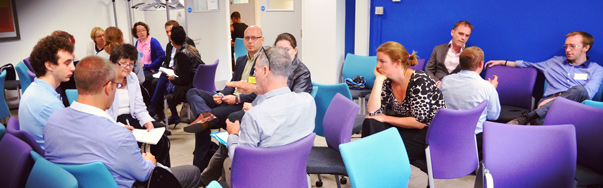
This was followed by a demo of the AnalytiXagility platform from Alison Bell (Lead Data Scientist, Aridhia). Five teams of 5-6 people were assigned, care was taken to ensure a balance of interests, experience and skill sets within each team. From 11am until 3pm, the teams worked with each other on the platform to profile the data, examine assumptions and define and test hypotheses whilst constructing a story for a 10 minute presentation at the end of the day.
Teams
Sophie’s thoughts about the day: “Working in a team of people with different expertise and backgrounds proved how much you could learn from the data and learn from each other in a day! I thought the event was a great success”.
Team 1
…consisted of people from QMUL, Farr, NEL CSU & Barts Health whose roles included a clinician, SQL and R analysts, an information manager from a CSU and Sophie from the Aridhia Data Science Team. Team 1 decided to investigate whether the investment in CVD/Diabetes in primary care had been responsible for the fall in unscheduled admissions since Q1 2011. Specifically is that fall confined to the top 5% at risk, and or is it confined to CVD/Diabetes/Respiratory cohort. They split this work into two parts, headed by an analyst in each team, one group looked at comparing the high risk population with the whole population, and the other compared the admissions for the 3 conditions above.
After the event Annie stated that “The breadth of discussion around the data, the completeness, the implications of using different risk models to categorise high risk patients in CCGs and the addition of a statistician really helped us come up with a simple, yet considered plan of analysis. The day was intense, but thoroughly enjoyable. The team were absolutely brilliant and it’s definitely something I’d like to work on again.”
Team 2
…included people from QMUL, NEL, and Waltham Forest CCG and consisted of a GP, a health economist, a commissioner, a statistician, two analysts and Annie from the Aridhia Data Science Team. The approach they took was to initially review the data available and decide what was possible within the timeframe. The diverse structure of the team allowed for some good discussion around what was of interest to them and the best way to prove/disprove their hypothesis. Team 2 looked at attendances over time in each CCG for all patients and compared to those categorised as high risk. They also looked at the demographics of the high-risk group and developed the basis of a stochastic model to quantify and predict the movement of a patient through various risk categories to assess how an integrated care plan could alter this.
Deborah’s feelings about the day: “Although the day was very intense and quite tiring, it was a wonderful to work directly with other people in the team who were from a clinical background and had a good knowledge of the data. We got off to a slow start due to a lack of people on the team who were comfortable in helping with the actual analysis, but we got there in the end and got some introductory results. Would have been great to have some extra time to look further into this on the day.”
Team 3
…came from QMUL CEG, NEL CSU, and Newham CCG and included a GP, two analysts, a commissioner and Deborah from the Data Science Team. The team looked at why patients move between risk bands, and therefore use up more resources. By brainstorming the problem to define an approach and methodology, they built a cohort table to define patients who had moved from medium to high risk within the period of one year from April 2011 to April 2012. This cohort was used to look at comorbidities split by age group. With further time the team would have liked to investigate further into why people have moved between risk categories (looking at diagnosis, procedures information) and demographics.
Harry’s thoughts on the day: “The team had a clear focus from the beginning as people obviously had things that they wanted to explore in the data and had thought about this beforehand. Our original proposal was probably a bit ambitious but we certainly made a start in the right direction. Having a multidisciplinary team with domain knowledge helped us get to grips with the data and iron out any problems quicker than would have been possible if it were a team of data analysts.”
Team 4
…included a GP, Waltham Forest CSU, Data Analyst (with SQL skills), CCG Business Intelligence Specialist (with SQL skills) and Harry from the Data Science Team. The two with SQL skills did some exploring along with Harry, who also did anything required in R. The plan was to somehow assess the reliability and actual significance of some predictive models currently used in healthcare. For example reports of interventions on patients with high risk having high impact could be at least partially explained by regression to the mean and other common statistical artefacts. Looked at patients admitted due to fractures, MI or Heart failure to define a clear subgroup of patients and showed at least that care should be taken when deciding at which point in time to take a risk score as this could seriously affect results of an analysis.
Some words from Spyros following the event: “From a technical point of view the analysts were glad that we were working close with the people that had a lot of interest about the data, and could provide us with interesting questions. On the other hand the rest of the team members were really keen on having hands on access to the data, and technical people that can formalize their questions and provide immediate answers from the data. The general feeling was excitement and enthusiasm together with a feeling that the multidisciplinary team members’ skills were complementary to one another resulting in a formidable combination.”
Team 5
…included people from NEL CSU, LSHTM, Barts Health, Tower Hamlets CCG, and QMUL CEG, whose roles included two analysts, a researcher, a commissioner, a business manager and Spyros from the Data Science Team. Their approach was to profile the data and figure out current actively registered patients for the 3 boroughs and to produce a clean cohort for all the boroughs. Following that they wanted to see what effect the avoidable admissions could have in the overall impact of high risk patients in the system. The process revealed some issues with patients moving around and so the team decided to branch off to look for people that were vanishing from records. They then shifted their focus towards creating a clean cohort of patients that were registered from 2012-03-31 onwards (with the predictive model requirements of 2 years’ worth of historical data in mind). In the process they discovered that the granularity of the data was different across our data sources. One of the Boroughs entire population records for example, had the same initial registration for all the patient; obviously that made comparisons and tracking patients more complex.
Presentations and results
From 3.30pm onwards each team presented their findings to an audience of esteemed judges. They included Dr Geraint Lewis (Chief Data Officer NHS England), Prof. Harry Hemingway (Director Farr London), Martin Bardsley (Director of Research Nuffield Trust), Geoff Alltimes (Senior Responsible Officer, Integrated Care and Support Pioneers programme NHS England), John Wardell (Deputy Chief Officer Tower Hamlets CCG and Director of Integration for WELC), Dr Phil Koczan (Chief Clinical Information Officer UCL Partners). While the judges deliberated, attendees were invited to express their feedback on the day. The response was overwhelmingly positive; the amazement and appreciation of being able to work with such a rich dataset and how this was managed from an IG perspective was the first comment. How easy it was to get to grips with the platform, and the support and knowledge of Aridhia’s team on the ground were cited as accolades as to why the event ran so smoothly. The security and remote access of the platform was mentioned several times as a key feature by the audience. After a tense 10 minutes the judges returned and announced the winner – Team 2.
Annie from the team said after the event: “All of the presentations were brilliant, but I think we won due to the diversity of the team. It reaffirms one of the core enablers of AnalytiXagility, which is collaboration and how important that is to succeed”.
The WELC data challenge day was a wonderful and unique opportunity to bring together the skills of data scientists, analysts, clinicians and commissioners all with the common aim of improving patient outcomes. The AnalytiXagility platform made viewing the data and analysis so easy, which aided the collaborative workflow of teams under the security of a safe haven. All of this would not have been possible without the collaboration of Aridhia’s IG, Data Science, Support and IS teams prior to the event. From the engine room, where we loaded data, performed validation testing, improved performance, and improved the UI to the front line, where we developed a series of analysis scripts to support exploratory analysis of on the day.
Congratulations to winners Team 2, and to Spyros and his team for being highly commended by the judges! There was a lot of positive feedback about the platform after the day’s activity from all participants involved. The platform performed really well under the intense of pressure of all that we threw at it! The platform proved to be an invaluable resource for easily seeing how data sets could be linked together, analysing the data and providing analysis tools for those with no experience of coding. I think that all involved got a lot out of the day, though a general consensus that more could have been achieved within a greater period of time.
Some words from the participants
‘We are extremely grateful to NEL CSU and Aridhia for making this possible, for the first time a wide range of people here, academics, researchers, universities and CCG’s have got access to full live datasets from primary and secondary care data, and I think that is astonishing and long may it continue… because you’re about to whip it away again at the end of the session, and we would like it back please’
‘I think today has been a real success and I look forward to sharing it with the rest of the pioneers on the programme’
‘This is the first time where we’ve been able to address joined up data sets… we’re now able to ask questions of connected data sets and its giving us some fascinating insights.’
‘We needed reassurance that our datasets were secure, one of the things that we were convinced about is that the Aridhia platform is physically secure and that no patients data could be identified.’