The Data Access Paradox – How Do I Get What I Need When I Can’t See If It’s There?
When embarking on a research project, you will always encounter problems. One of the most tiring ones, is what has come to be known as the data access paradox. You instinctively know what kind of data will support your work, and have found your way to a repository that, on the surface, seems to contain the data you need. Unfortunately, you don’t know what specific record-level data is obtainable or even suitable for your study before you’ve gone through the process of requesting, receiving, and then parsing it. What if you had a way where you could quickly tell if a dataset was going to be appropriate, without going through a (potentially) lengthy data access request process? The Aridhia DRE has a solution…
Exploring available data, understanding the ‘shape’ of data and getting insight into whether or not that data has what you need, without viewing record level data, is crucial to effective research projects. Using the Aridhia DRE Cohort Builder, a new feature in our FAIR Data Services component, can ensure that the datasets you are requesting have exactly what you need for your study. It can support your request by providing high level analysis that can be shared with data owners and reduce the time to approval.
Making data as easy as possible to for you to find is a key goal of ours at Aridhia. This is why the Aridhia DRE adheres to the FAIR data principles and we’re continually improving how data can be searched and indexed.
Data Access
Understandably, until the data is in the project’s secure workspace, you can’t view the individual records. There may be a fully defined set of dictionaries for the dataset, with links to ontologies to ensure a consistent understanding of what should be expected in the dataset. You can also be sure that a dataset in FAIR has been validated and the records are consistent with what is defined in the dictionary. An extensive catalogue may provide rich meta-data, giving you further descriptive information on the data, but you really can’t be sure if what you want to see in that data is there until it’s in your workspace. When you’ve found that data, that’s only the start of what can be a long wait for approval.
The Aridhia DRE automates the data access request process significantly, capturing and validating form input and ensuring a target workspace exists for the project. It allows for complex workflows involving multiple stakeholders in a review process and automating that at every step along the way; but ensuring sign off from multiple stakeholders can involve legal documentation, digital sign-off and review boards. All of this is intended to reduce the time and friction for data access, allowing the researcher more time on the science while remaining compliant with the specific governance rules associated with a dataset.
Once your data has been securely and reliably transferred from FAIR into your Aridhia DRE project workspace… it’s time to have a look. You load up the data in the data table editor and start to search through the rows and columns, building a mental picture of the shape of the data. You join the numerous tables that formed the dataset together and start to build queries to find what you’re really interested in before realising, there’s just not enough of a particular subset of records that match your hypothesis. Perhaps there’s a high degree of ‘missingness’ within the data and key records aren’t complete. The data doesn’t provide what you need. So, you go back to FAIR to search again. Cohort builder is there to make this frustrating piece of the process go away so you can spend more time being more productive on the science.
Introducing the Cohort Builder
Using Cohort Builder, a new feature of the Aridhia DRE you can qualify a dataset before submitting your request and determine if a subset of the records within a dataset meet the requirements for your project. We call this subset a cohort. The Cohort Builder provides a powerful query building mechanism combined with interactive dynamic charting to quickly explore a dataset, understand the shape of the data, and determine if it meets your hypothesis while preventing access to record level data.
It provides a powerful user interface to build rich queries that join multiple tables together, without the need for writing complex code or a complex database query language such as SQL. Users can combine query clauses using AND/OR and build expressions to filter across large volumes of heterogenous data. For example, exact match, ‘like’, includes, null, not null, >, <, =, !=, and more. Multiple cohorts can be combined and compared on the same chart, allowing for instant comparisons and quick analysis using bar charts, stacked charts, box plots and histograms.
Later, when submitting your access request, you can then select to receive either the entire dataset, or an assortment of the specific cohorts you have identified. This feature will aid researchers in the speed of their access requests, avoid the effort of trawling through potentially irrelevant data, and give greater visibility to all available datasets. Users can spend more of their time focusing on what’s important: their analysis and, ultimately, delivering better outcomes for patients.
Example Build
Perhaps you’re interested in performing a study across retired people, who have a family history of diabetes and known co-morbidities. You want to look at the range of BMI of participants in a study and determine if there is a cohort of that dataset that would help in your own study.
Open cohort builder and create a new cohort. You build a query for males over 65 with a family history of dementia, and another for females over 60, also with a family history of dementia. You bring up a stacked bar chart immediately showing you the number of records that match that query across the entire dataset.
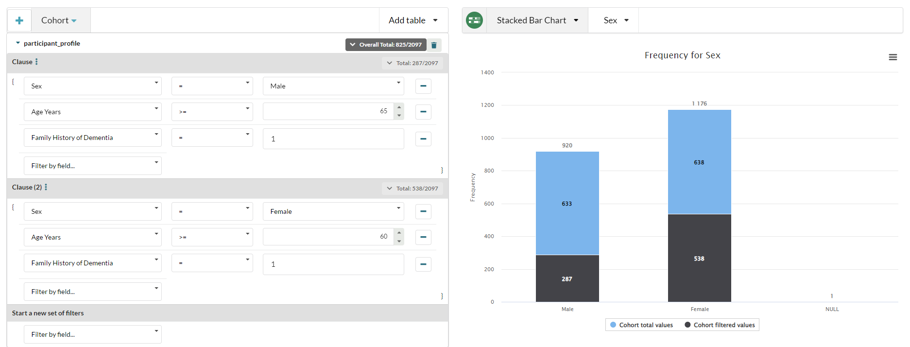
Here we can see that out of the total of 2097 records, 1176 of them match this query.
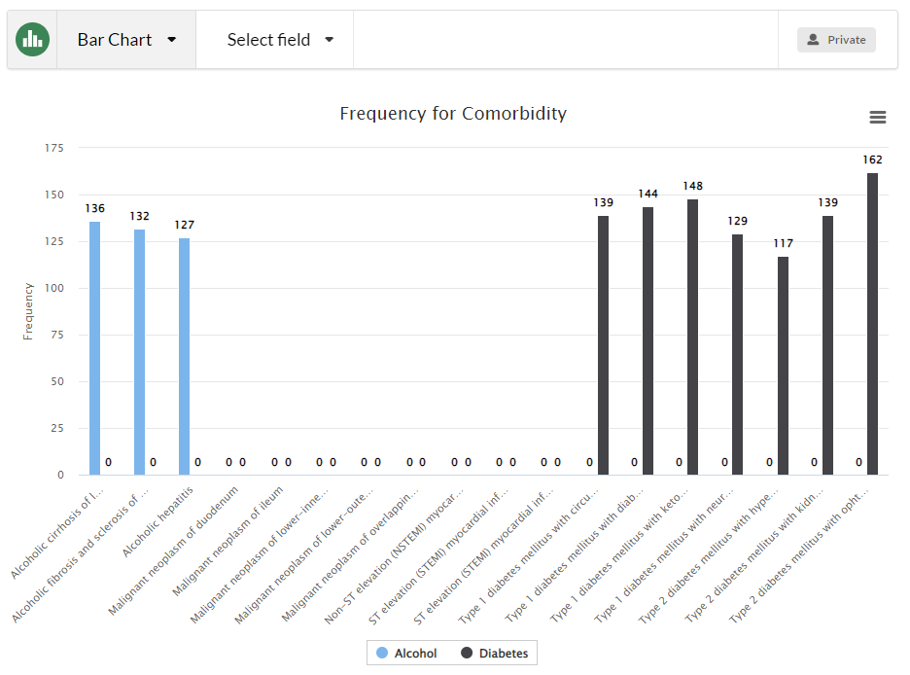
You know there is another dictionary in this dataset, sharing the same Positive Patient Identification value, with comorbidity information. You include this in your queries and use all comorbidities that include the term ‘alcohol’. You want to compare that cohort with one where the participants have a diabetes comorbidity. So, you clone the cohort, and edit the clause where you included the comorbidity dictionary and change ‘alcohol’ to ‘diabetes’. Finally, you plot both these cohorts together showing the various APOE values and BMI spread in a boxplot.
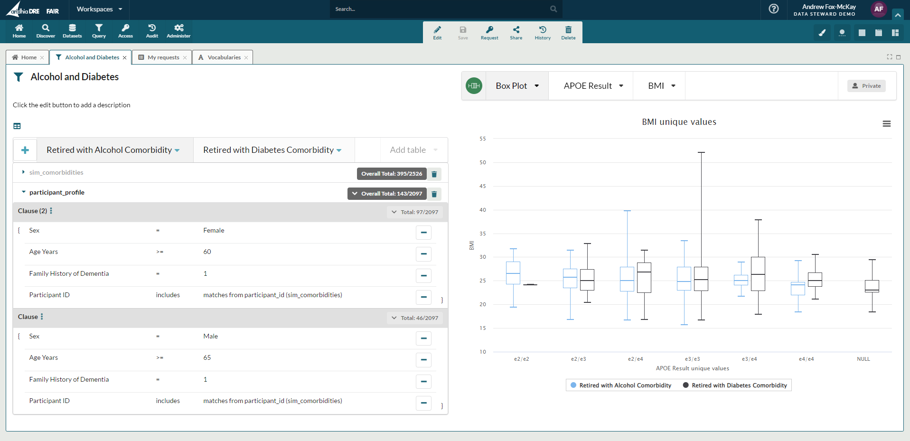
Now you have this, without looking at the record level data and going through a potentially lengthy DAR approval process, you can determine if this dataset is the one you need to help with your study. You can also export these charts as a .png or .jpg for inclusion in any supporting documentation you may need during the DAR process, which could enhance the likelihood of approval and reduce the time it takes to receive that approval.
Knowing that this dataset contains a statistically significant amount of records for your study, you can request this subset specifically. There’s no reason to request data you don’t need, that you’ll just have to do work in your project workspace to remove or negate – so you can request only the exact data you need and it will be delivered securely and reliably to your workspace, complete with meta-data and data receipt that you would expect from the Aridhia DRE FAIR Data Services.