Blogs & News
Uses of Open Data
Accident and Emergency (A&E) attendance
The UK Government launched its Open Data initiative in 2010, in a bid to make data available to drive innovation and improvement, as well as creating transparency.
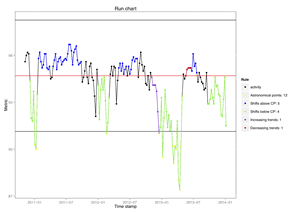
We used a data set made available by NHS England detailing the number of weekly A&E attendances for all A&E types, including Minor Injury Units and Walk-in Centres. We identified the number of patients discharged, admitted or transferred within four hours of arrival.
Hospital waiting times can be indicative of the level of patient care on offer. NHS England have a target of 95% for patients to be seen within 4 hours. We used this data to capture and visualise trends of A&E attendance over time, helping to provide actionable insights.
Read our recent blog post Mapping
hospital admission data to Scottish datazone for more detail on how AnalytiXagility can be used to gain valuable insights from data sets.
Open Glasgow: Future City
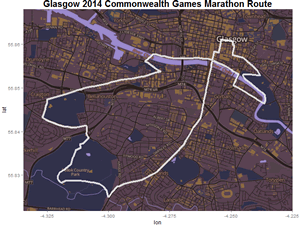
Smart Cities is a collective effort across the UK to bring together open data and intelligent technology to enhance the quality of life in urban environments.
As part of this initiative, Glasgow beat 30 other cities across the UK to win Future City funding worth £24 million from the Technology Strategy Board to develop a future cities demonstrator. Open Glasgow was created as the platform to facilitate this and they have curated a vast series (679) of datasets that include (but not explicitly): health, travel, education, the economy, and environmental information.
We are looking at ways to link isolated datasets together and derive insights that could support the projects aim to make cities smarter, safer and more sustainable through technology.
Read our recent blog post Visualising air pollution data over time for more detail on how AnalytiXagility can be used to gain valuable insights from open data.
Survival Analysis on SEER dataset
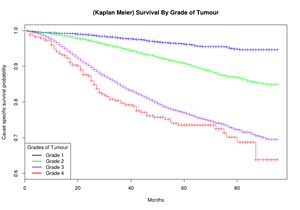
We used data from the Surveillance, Epidemiology, and End Results Program (SEER) which contains incidence and population information as well as a large number of features about patients diagnosed with 7 different types of cancer from 1973 – 2011.
This dataset is ideal as it includes several recordings of variables to reflect changes in diagnosis and methods over the years and is characteristic of the effort it takes to keep such an attempt going over a prolonged period of time. We focused on the subset of patients with breast cancer and following some indicative guidelines from the National Cancer Institute, we extracted unbiased datasets and performed Kaplan Meier and Cox Proportional Hazards Survival Analyses, as well as a set of descriptive statistics that explained the qualitative characteristics of the data.
General Practice Prescribing Data
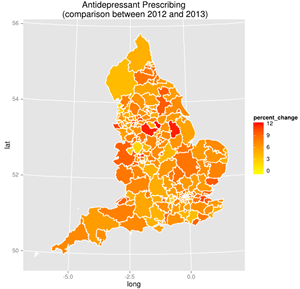
The UK government has made a commitment to transparency in the public sector and has also expressed its vision for the use of GP practice level prescribing data to support its Plan for Growth.
Using open data released by HSCIC we analysed and compared prescribing trends across Clinical Commissioning Group’s (CCG). We also used this data to create maps showing the relationship between deprivation and groups of drugs.
Pancreatic Cancer – Genomic Annotation
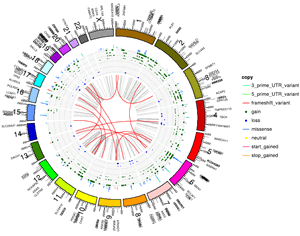
Using data from the International Cancer Genome Consortium, we analysed the genomic data for 351 donors with pancreatic cancer.
The visualisations produced from the analysis of this dataset combined clinical information and genomic data from the donor’s samples. Genetic mutations were plotted in a ‘Circos like’ plot with additional layers containing information about structural variation, copy number variation and mutation frequencies for all chromosomes, along with annotation indicting the severity of mutations. Additionally, the base functionality was extended to provide a customisable zoom into regions of interest.