Blogs & News
Getting Started with AnalytiXagility Mini-apps
As you may know we launched the updated version of AnalytiXagility last week, and the platform now includes some great new capabilities in the form of mini-app data visualisations, audit and R parallelisation. Today I’m going to look at mini-apps, and how to get started using them to rapidly visualise your data. If you’re unfamiliar with what we mean by mini-apps, you should watch this video to see some of the great ways you can bring your data to life.
We integrated Shiny by RStudio into the AnalytiXagility platform to bring you the mini-app capabilities. Laurence from our development team explains a bit more about that process here. Shiny is a package in R that allows the creation of interactive web applications that can be run locally in RStudio or online. I’m going to introduce you to the Shiny framework and some components that will help you understand how to build a mini-app from scratch using the integrated Shiny functionality and run this from within AnalytiXagility.
Learning outcomes
This blog post covers:
- How to define the Shiny mini-app framework in AnalytiXagility
- How to create a simple mini-app in AnalytiXagility
- Reactive programming
Step 1 – The Shiny mini-app structure
Shiny apps require two source files; ui.r and server.r.
The ui.r file defines the front end and contains visual components associated with our app (e.g plots, widgets, text etc), whilst server.r is the back end work horse that contains the functionality.
The skeleton structure for each file is as follows:
ui.r
library(shiny)

shinyUI(
    fluidPage()
)
server.r
library(shiny)

shinyServer(function(input, output) {

})
To create these files in AnalytiXagility follow the steps below:
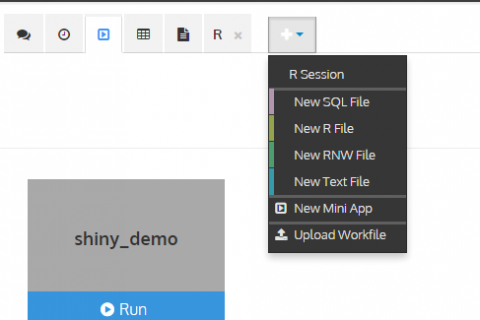
1. Go to the ‘+’ button and click on ‘New Mini-App’
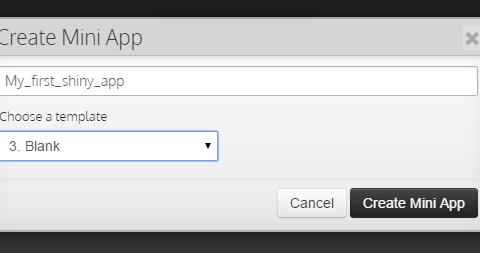
2. Decide on a name for your mini-app and a template to use, then click on ‘Create Mini-App’
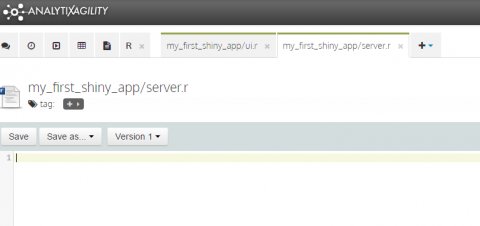
This will open a ui.r and server.r for the mini-app you have just created.
Running the above code in these files will result in an empty mini-app being generated.
Step 2 – The User Interface
Layout of the UI
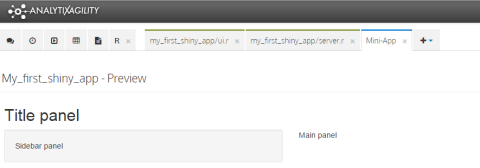
Now we have the basic structure of the Shiny mini-app, let’s start constructing a front end through ui.r. In the skeleton ui.r, we included the fluidPage() function, which is used for creating fluid page layouts. A fluid page layout consists of rows which in turn include columns. Fluid pages scale their components in real-time, which means that our page will adjust to the window size automatically. Start adding components to the fluid page, the script below describes how to add basic panels: titlePanel, mainPanel and the sidebarPanel.
ui.r
library(shiny)

shinyUI(
  fluidPage(
    titlePanel("Title panel"),

    sidebarLayout(
      sidebarPanel( "Sidebar panel"),
      mainPanel("Main panel")
      )
  )
)
HTML objects used in the User Interface
Shiny provides an interface that allows us to add HTML components (like text, headers, hyperlinks etc). We can see a table below with some of the available functions.
| Shiny function | HTML tag | Description |
|---|---|---|
| p | <p> |
A paragraph of text |
| h1 | <h1> |
A first level header |
| h2 | <h2> |
A second level header |
| h3 | <h3> |
A third level header |
| h4 | <h4> |
A fourth level header |
| h5 | <h5> |
A fifth level header |
| h6 | <h6> |
A sixth level header |
| a | <a> |
A hyperlink |
| br | <br> |
A line break (e.g. a blank line) |
| div | <div> |
A division of text with a uniform style |
| span | <span> |
An in-line division of text with a uniform style |
| pre | <pre> |
Text ‘as is’ in a fixed width font |
| code | <code> |
A formatted block of code |
| img | <img> |
An image |
| strong | <strong> |
Bold text |
| em | <em> |
Italicized text |
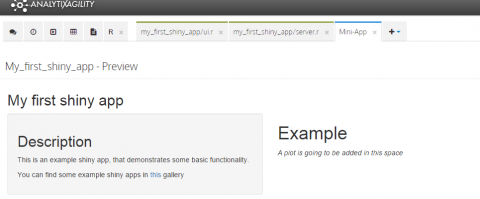
Below we can see our example using HTML components:
ui.r
library(shiny)
shinyUI(
fluidPage(
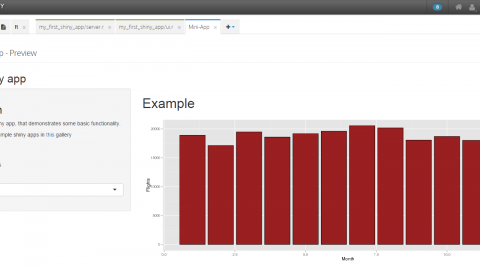
titlePanel("My first shiny app"),
sidebarLayout(
sidebarPanel(
h2("Description"),
p("This is an example shiny app, that demonstrates some basic functionality."),
p("You can find some example shiny apps in ", a("this", href = "http://shiny.rstudio.com/gallery/"), "gallery")
),
mainPanel(
h1("Example"),
em("A plot is going to be added in this space")
)
)
)
)
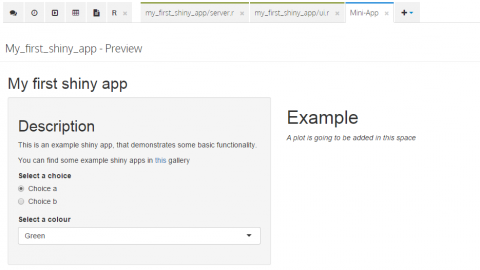
Adding Widgets
Widgets are the components that allow us to interact with the app. Some example types of widgets include:
For more see the further reading section.
Adding some example widgets to the example mini-app we have:
ui.r
library(shiny)

shinyUI(
  fluidPage(
    titlePanel("My first shiny app"),

    sidebarLayout(
      sidebarPanel(
          h2("Description"),
          p("This is an example shiny app, that demonstrates some basic functionality."),
          p("You can find some example shiny apps in ", a("this", href = "http://shiny.rstudio.com/gallery/"), "gallery"),
          radioButtons(
            inputId = "widget-1",
            label = "Select a choice",
            choices = c("Choice a" = "a", "Choice b" = "b"),
            selected = "a"
          ),
          selectInput(
            inputId = "widget-2",
            label = "Select a colour",
            choices = c("Blue" = "#18425D", "Red" = "#991F21", "Green" = "#96A74C"),
            selected = "#991F21"
          )
        ),
      mainPanel(
          h1("Example"),
          em("A plot is going to be added in this space")
        )
      )
  )
)
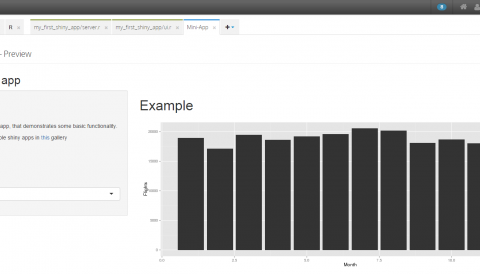
Step 3 – The Server
So now that we have designed the front end in ui.r, let’s add in back end functionality to server.r and link together to create an interactive mini-app.
Reactive expressions
Reactive expressions allow us to display interactive outputs in the UI that change according to the inputs, e.g. selecting subsets of data to plot interactively. Let’s add in a reactive expression to a mini-app. For this example we will be using the hflights data set that contains information of the flights from Houston in 2011, and packages dplyr and ggplot2 for data manipulation and plotting respectively:
server.r
library(shiny)
library(hflights)
library(dplyr)
library(ggplot2)

shinyServer(function(input, output) {

  output$plot <- renderPlot({
    flights_per_month <- hflights %>% group_by(Month) %>% summarise(Flights = n())
    flights_per_month_plot <- ggplot(flights_per_month, aes(x = Month, y = Flights)) + geom_bar(stat = "identity")
    flights_per_month_plot
  })

})
The output variable is a data frame that we add all the components that we want to display in the UI. Here we are passing a plot object to be displayed in the UI within a renderPlot({}) function, where both the data manipulation and plotting are taking place. This is an example case of a render function that displays a reactive plot. Different types of render functions are used for different types of output:
| Render function | Creates |
|---|---|
| renderImage() | images (saved as a link to a source file) |
| renderPrint() | any printed output |
| renderTable() | data frame, matrix, other table like structures |
| renderText() | character strings |
| renderUI() | a Shiny tag object or HTML |
Only results of a render function can be added to the output variable.
In order to display the reactive output to the UI we must make a reference to it:
ui.r
library(shiny)

shinyUI(
  fluidPage(
    titlePanel("My first shiny app"),

    sidebarLayout(
      sidebarPanel(
          h2("Description"),
          p("This is an example shiny app, that demonstrates some basic functionality."),
          p("You can find some example shiny apps in ", a("this", href = "http://shiny.rstudio.com/gallery/"), "gallery"),
          radioButtons(
            inputId = "widget-1",
            label = "Select a choice",
            choices = c("Choice a" = "a", "Choice b" = "b"),
            selected = "a"
          ),
          selectInput(
            inputId = "widget-2",
            label = "Select a colour",
            choices = c("Blue" = "#18425D", "Red" = "#991F21", "Green" = "#96A74C"),
            selected = "#991F21"
          )
        ),
      mainPanel(
          h1("Example"),
          plotOutput("plot")
        )
      )
  )
)
In this example we have a plot output so we are using the plotOutput function. For other types of output we have:
| Output function | creates |
|---|---|
| htmlOutput raw | HTML |
| imageOutput | image |
| tableOutput | table |
| textOutput | text |
| uiOutput | raw HTML |
| verbatimTextOutput | text |
Apart from the render functions, we can have reactive chunks of code in a reactive({}) call. These operate as functions. They can not be directly assigned in the output variable, but they can be used to split up the process taking place in a render function. In our case, data manipulation and plotting could be handled separately:
library(shiny)
library(hflights)
library(dplyr)
library(ggplot2)

shinyServer(function(input, output) {

  group_flights_per_month <- reactive({
    flights_per_month <- hflights %>% group_by(Month) %>% summarise(Flights = n())
    flights_per_month
  })

  output$plot <- renderPlot({
    flights_per_month <- group_flights_per_month()
    flights_per_month_plot <- ggplot(flights_per_month, aes(x = Month, y = Flights)) + geom_bar(stat = "identity")
    flights_per_month_plot
  })

})
The input variable
Now we need to connect the output with the widgets in order to have a fully interactive mini-app. This can be done using the input variable. This variable is a data frame that contains all the current values of all the widgets. We can use a widget’s id in order to retrieve the current value and act accordingly:
ui.r
library(shiny)

shinyUI(
  fluidPage(
    titlePanel("My first shiny app"),

    sidebarLayout(
      sidebarPanel(
          h2("Description"),
          p("This is an example shiny app, that demonstrates some basic functionality."),
          p("You can find some example shiny apps in ", a("this", href = "http://shiny.rstudio.com/gallery/"), "gallery"),
          radioButtons(
            inputId = "widget-1",
            label = "Select a choice",
            choices = c("All flights" = "all", "Not cancelled flights" = "not_cancelled"),
            selected = "all"
          ),
          selectInput(
            inputId = "widget-2",
            label = "Select a colour",
            choices = c("Blue" = "#18425D", "Red" = "#991F21", "Green" = "#96A74C"),
            selected = "#991F21"
          )
        ),
      mainPanel(
          h1("Example"),
          plotOutput("plot")
        )
      )
  )
)
server.r
library(shiny)
library(hflights)
library(dplyr)
library(ggplot2)

shinyServer(function(input, output) {

  group_flights_per_month <- reactive({
    if(input$"widget-1" == "not_cancelled") {
      flights_info <- hflights %>% filter(Cancelled == 0)
    }
    else {
      flights_info <- hflights
    }
    flights_per_month <- flights_info %>% group_by(Month) %>% summarise(Flights = n())
    flights_per_month
  })

  output$plot <- renderPlot({
    flights_per_month <- group_flights_per_month()
    flights_per_month_plot <- ggplot(flights_per_month, aes(x = Month, y = Flights)) +
      geom_bar(stat = "identity", colour = 'black', fill = input$"widget-2")
    flights_per_month_plot
  })

})
Reactive components will run when a user is visiting the mini-app and will re-run every time a user changes the value of a widget that is being used in this reactive component. Also, in this case, all other reactives that depend on this one will run again. In our example when we change the filtering according to whether a flight was cancelled or not, both reactives run again, but when we change the colour of the plot only the renderPlot({}) will run again. Because of this it is generally better, performance-wise, to split up the server code in multiple reactive chunks, instead of having a large render function.
Server function execution
Another important issue is where in the server.r file to place different commands, for example where should we read the data. In order to resolve that we need to know
what parts of code are running when:
- Everything in the
server.rfile will run once when we launch the app. - The function that is being called by the
shinyServerfunction will run every time a user is being visiting the mini-app (e.g. when someone opens it in a web browser, or refreshes the page) - The reactives run many times, when the app launches, when a user visits the app and every time a widget they depend on changes.
So, depending on the kind of application we want to build reading the data can be different:
- If we are building a mini-app for demonstration reasons that uses a fixed dataset, we can read the data in the
server.rfile, outside theshinyServerfunction. This is what is going on with our example (the data are being loaded with the calllibrary(hflights)). - If we are building a mini-app based on data that are being updated often, we should probably read the data inside the
shinyServerfunction, and keep the same dataset for each separate session. That means that every time a user visits the app, the data, including the most recent updates, will be loaded. - If we are building a live app, that updates its output according to a timer, we should read the data inside a reactive. For instance, if we have a plot that shows how a stock price moves and updates every second, we should read this price in a reactive that depends on a timer.
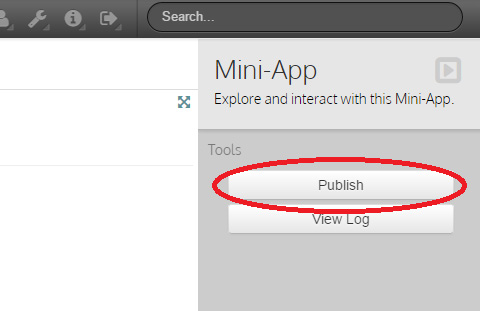
Publish the mini-app within the platform
Finally, once we are happy with our mini-app we can publish it in AnalytiXagility to share with other members of the workspace by clicking on the ‘publish’ button on the right hand side: