Blogs & News
Reproducing a Genome-Wide Association Study in an Aridhia DRE Workspace
This summer I worked at Aridhia on producing one of the two scientific reproducibility demos focusing on Randomised Controlled Trials and Genome-Wide Association Studies (GWAS). In this post, I will introduce you to GWAS and walk you through the challenge of reproducing it in Aridhia DRE Workspace.
What is GWAS?
A genome-wide association study (GWAS) is an approach used in genetics research to associate specific genetic variations with particular diseases. GWAS typically searches for small variations in the genome, known as single-nucleotide polymorphisms (SNPs), that occur more frequently in people with a particular disease than in people without the disease. GWAS already has seen great success at identifying SNPs related to conditions such as diabetes, Parkinson’s and Crohn’s.
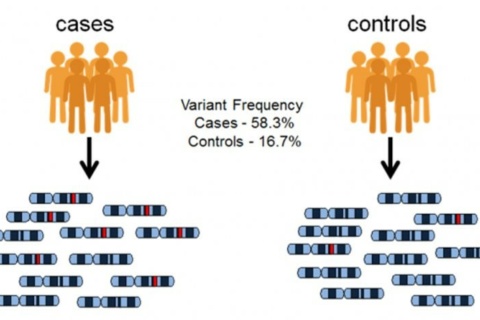 In the case/control GWAS study, researchers typically have two groups of participants: people with the disease being studied (case group), and similar people without the disease (control group). Each person gives a sample of their DNA, from which millions of SNPs are read in. If certain SNPs are found to be significantly more frequent in people with the disease compared to people without the disease, the variants are said to be associated with the disease.
Challenges
Reproducing a GWAS study is not a simple task, as we need to find a standard case-control GWAS study that would meet these three criteria: fairly simple analysis, well-documented methods, and publicly available data. We will also be dealing with large genomics datasets and need specialized bioinformatics software to process the data.
Finding publicly available data turned out to be the greatest challenge of the project, almost an impossible one, as almost all human genomes sequenced for research, for example through the UK 100,000 Genomes Project and UK Biobank, remain private and are only made available to authorised researchers after personal identifying details have been removed.
After a lot of research, we came across a Webster et al. (2009) study with publicly available genotyping data. The study investigates the relationship between common inherited genetic variants and brain transcript expression in Late-Onset Alzheimer’s Disease. The paper did multiple types of analysis, so it did not quite fit our ‘standard GWAS case-control study with simple analysis’ criteria, but having open access data was essential for implementing GWAS in the workspace. Thus, we decided to focus on method reproducibility by following standard GWAS analysis procedures from other case-control studies but using the Late-Onset Alzheimer’s Disease data from Webster et al. (2009) study.
Case study: Late-Onset Alzheimer’s Disease
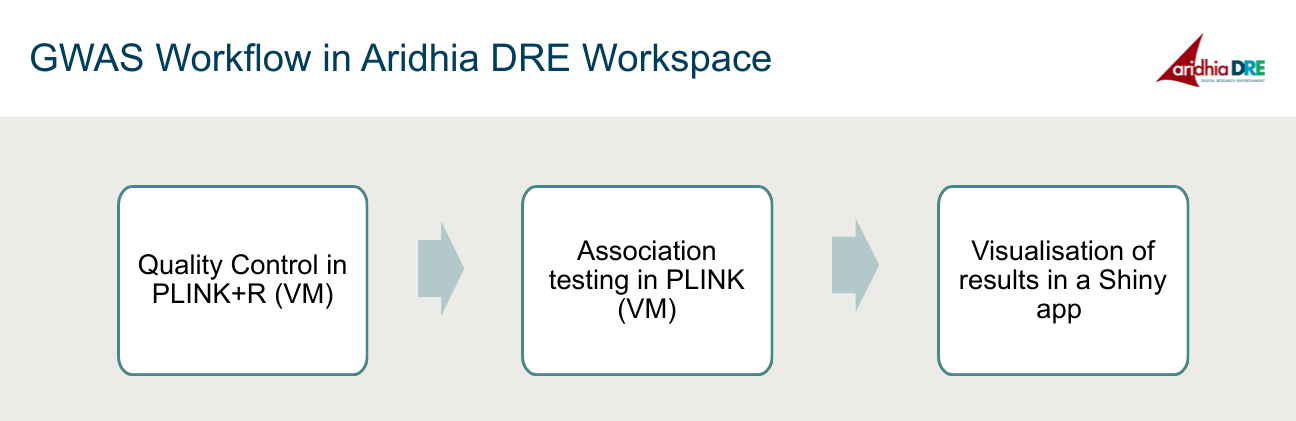
In order to reproduce GWAS in Aridhia DRE workspace, we have divided the analysis into three steps: data quality control, which will be done using statistical computing language R and whole-genome analysis software PLINK, all run in the Jupyter Notebook on the Linux Virtual Machine, association testing, and GWAS results visualisation in a web app.
Quality control is extremely important as GWAS relies on high quality genotype data. In this step, we will be checking whether the person’s reported gender matches their biological gender, whether the samples are related, computing what proportion of data is missing and so on. After applying all these checks, we remove all the samples and SNPs that fail our quality control and create a clean dataset.
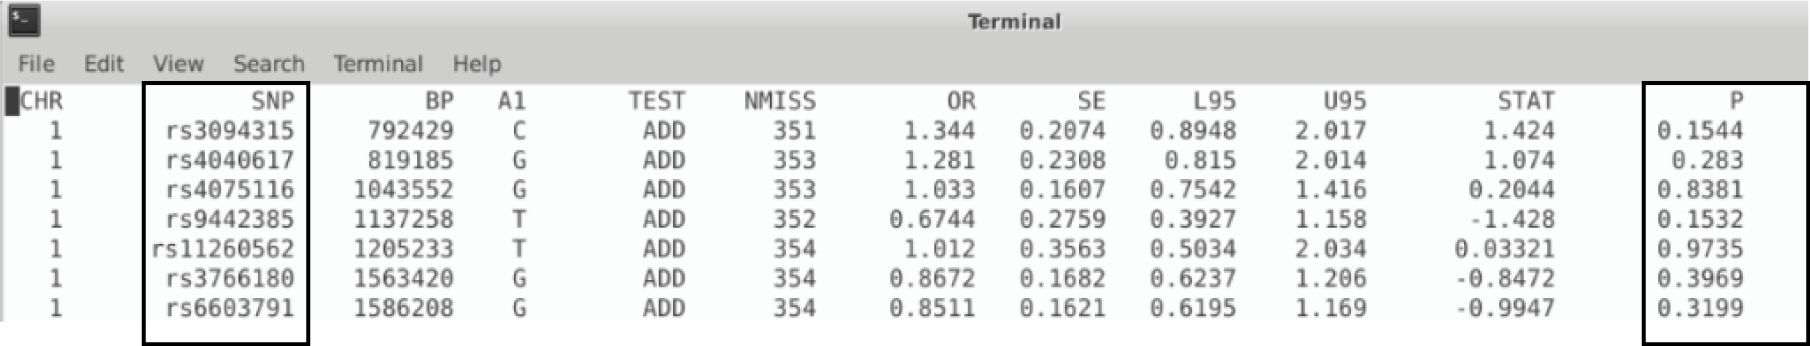
Once we have quality-controlled dataset, we can move on to association testing. The SNPs associated with the disease are identified by testing for statistical significance between cases and controls. Since this is a binary (case/control) study, we use logistic regression for the association. This step produces a text file which contains all the SNPs and their P values. We can tell which genetic variants are significant just by looking at this text file, but it is definitely not the most convenient way.
To make the GWAS results visualisation easier, we created a web app within the Aridhia DRE Workspace. GWAS results are first displayed in an interactive Manhattan plot with the negative logarithm of the P-value plotted against the position in the genome. The red line represents a genome-wide significance threshold, thus SNPs above it will be associated with the Late-Onset Alzheimer’s disease. We see that the two significant SNPs are located in chromosome 19 and that their IDs are rs429358 and rs4420638.
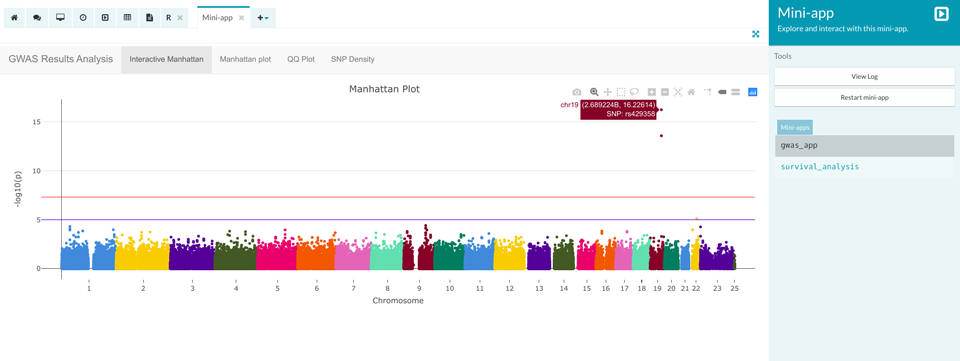
SNPedia tells us that rs429358 SNP is located in APOE gene and that people with (C; T) allele have >3 times increased risk for Alzheimer’s. Similarly, certain alleles of the rs4420638 SNP also have an increased risk for Alzheimer’s. So, this is a great result since the genetic variants that our GWAS found are confirmed by other studies to be associated with Alzheimer’s disease. Unfortunately, since we used the data from a study that had slightly different research goals, we cannot make a direct result comparison.
Thoughts on Reproducibility
Method reproducibility is the most important aspect of GWAS studies as it involves providing enough detail so that analysis can be repeated. We found that most of the case/control studies had very similar GWAS analysis steps, which we generalised and reproduced in the Aridhia DRE Workspace. However, we did note that researchers sometimes did not provide enough detail to make their methods reproducible, especially when reporting quality control criteria for SNP/sample exclusion.
If you want to reproduce our Late-Onset Alzheimer’s Disease GWAS, you can find detailed instructions and code in this Aridhia GitHub repo.