Blogs & News
Using Data to Improve Diabetes Care
Summary
Large population data analysis provides useful clinical feedback to healthcare providers and national organisations, which aids the wider communication and understanding about changing healthcare demographics. A focus on risk-factor profiling enables early preventive care strategies, reducing subsequent complications and costly hospital admissions.
Diabetes in the UK – What is the Problem?
In 2008, a report by Diabetes UK1 estimated that diabetes accounted for around 10% of NHS expenditure, equating to £9 billion per year, or £1 million every hour. This was double a 2001 estimate (Department of Health, 2001)2, showing the impact of a rising prevalence across the UK. A subsequent report in Diabetic Medicine3 predicts NHS annual spending on diabetes will increase from £9.8 to £16.9 billion over the next 25 years, reaching 17% of the entire NHS budget. The prevalent national diabetes population of Scotland has increased from 103,835 (2%) in 2002 to 258,570 in 2012, representing 5% of the Scottish population (Scottish Diabetes Survey)4.
Worldwide Perspective
This epidemic of diabetes in the UK is mirrored around the world as a result of rising obesity rates and increasing longevity. Many countries with rapidly emerging economies such as China, South East Asia, South America and Africa will see the most dramatic rises in diabetes rates over the next few decades, as wealth generation leads to adoption of more sedentary behaviour and poorer, high-fat, Western-style diets. In many Middle Eastern countries, around 1 in 5 of the population already has diabetes (see later example).
Scotland Diabetes Policy and Care Standards – Aspiring to Better Care
The Scottish Diabetes Action Plan5 suggests that “Diabetes has been recognised for at least 10 years as an exemplar long-term condition, both in terms of the growing number of people with type 2 diabetes and in terms of the serious and expensive complications it can bring in its train. Maintaining and improving the quality of diabetes services against a backdrop of increased incidence and prevalence, and the consequent pressure on those services, forms a key challenge facing NHS Scotland”. In its report “Delivering for Health”, NHS Scotland set out a focus on preventive self-care (promoting wellness), and decreasing costly acute care necessitated by illness events6. The Scottish Diabetes Action Plan5 encourages the ‘optimal use of new technology’ to improve diabetes care, specifically “Optimis(ing) sharing of clinical information through the increased use of the NHS Boards’ diabetes databases during routine clinical care”. Timely analytic reporting could help support this and many of the other priorities of this plan – particularly those around patient safety, complication prevention, and emergency admission reduction through early risk stratification and a system to monitor quality improvement. The annual Scottish Diabetes Survey (SDS)4 collects quality performance data from all health care trusts in Scotland through the SCI-diabetes diabetes Informatics platforms. This national annual report informs the diabetes community about care quality and drives care improvements …. but only once a year; access to more timely analytics could further enhance these services and understanding. See Appendix B for metrics measured in the Scottish Diabetes Survey. In England, the national diabetes audit serves a similar purpose but suffers from a lack of uniformity in data collection.
Quality Targets
Reporting on diabetes prevalence, complication rates and care quality is essential to inform the government, health sector, Non-Government Organisations (NGOs) and the public at large, and allows appropriate resource allocation and policy directive. Within the UK, care quality is often mapped against quality targets from best practice guidelines such as:
- SIGN7, for example, Guideline 116 (Management of Diabetes): Examples of SIGN diabetes guideline statements that have been translated into quality targets:
- All patients over the age of 40 with diabetes should be offered statin therapy.
- Patients with diabetes should aim for a BP target of 130/80.
- All patients should have annual foot screening and retinopathy screening.
- NICE Guidelines8
- DUK 15 Care Measures9: See Appendix A for a list of 15 care measures
- Quality Outcomes Framework (QOF)10 in Primary Care included diabetes-related targets. General Practitioners are financially rewarded for achieving targets relating to care quality. Regular monitoring of diabetes care targets for this purpose is therefore essential for individual practices, primary care collectives and commissioning bodies. A summary of QOF guidance11 can be found here.
What are the Impact and Cost Savings of Better Informed Decisions using Data Reporting for Diabetes Care?
In Scotland, the development of a diabetes disease registry (SCI-diabetes) and regular data reporting around quality measures has been widely cited as an example of international best practice. SCI-diabetes, which started as a research database in NHS Tayside, has been rolled out and developed throughout Scotland. Since implementation, dramatic improvements have been reported in achievement of quality outcomes target such as regular monitoring of HbA1c, timely foot screening and eye screening, measurement of HbA1C, ACR, blood pressure, cholesterol (Figure 1). In addition, diabetes complication rates have reduced significantly. Schofield et al12 demonstrated a reduction in diabetes amputation, and Vallance et al13 a reduction of retinopathy requiring laser treatment over the period of informatics implementation and data usage (Figures 2 and 3). This has the potential to translate into massive long-term cost savings for the NHS through the prevention of costly hospital admissions and complications care. Figure 1: Improved Recording of Key Biomedical Markers; Scottish Diabetes Survey 2002-2007. (Data recorded within the previous 15 months) 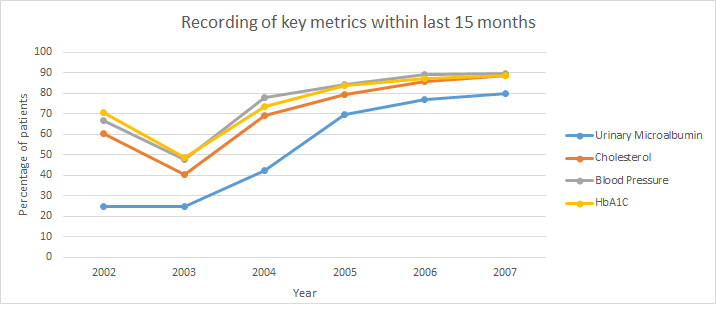 Figure 2A: Incidence of adjusted total amputation with 95% confidence intervals (solid lines) and incidence of adjusted major amputation with 95% confidence intervals (dashed lines) per 1000 patients with diabetes. Incidence adjusted for sex and diabetes duration.
 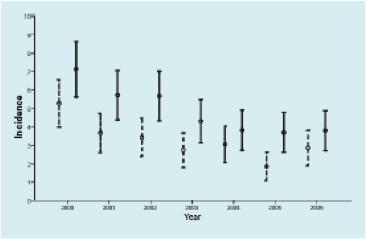 This figure was taken from an original paper “Decreasing amputation rates in patients with Diabetes- a population-based study” by Schofield et al10, demonstrating a 40% reduction in diabetes-related amputations between 2000 and 2009- following the introduction of the SCI-diabetes informatics platform. Incidence of adjusted total amputations with 95% confidence intervals (solid lines) and incidence of adjusted major amputations with 95% confidence intervals (dashed lines) per 1000 patients with diabetes. Incidence adjusted for age and sex. Figure 2B: Contains the amputation and eye laser figures from above combined into one graph.
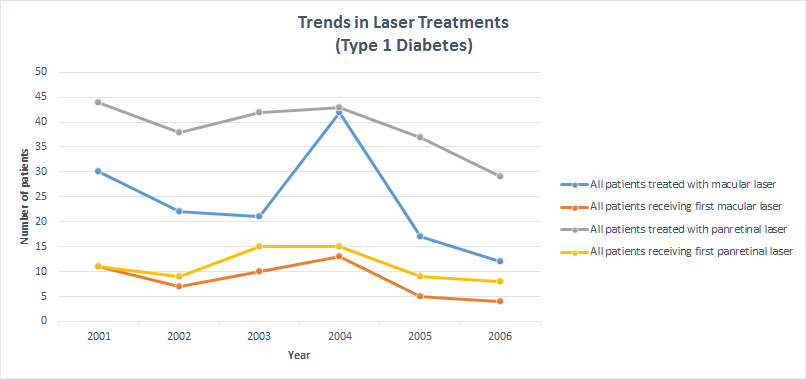
 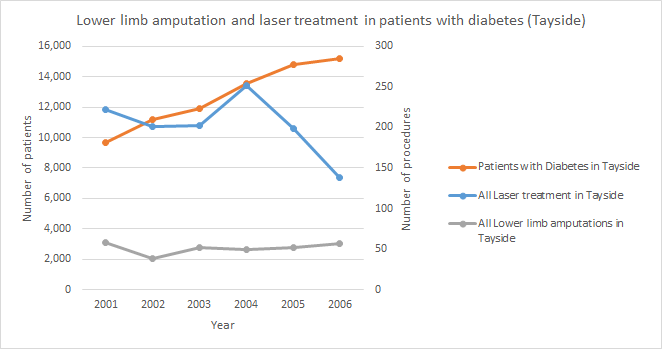 Figure 3: From an original paper “Diabetic Retinopathy; More Patients, Less Laser; A longitudinal population-based study in Tayside, Scotland” by Vallance et al13, demonstrates a 43% reduction in macular laser therapy between 2001 and 2006 (p,0.03). Both graphs show the trends in laser treatment during 2001-2006, for Type 1 and Type 2 diabetes.
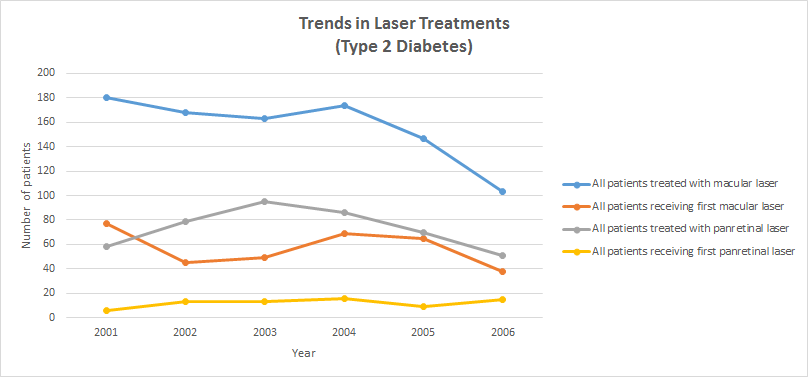
Case Example: Aridhia Informatics Ltd. – Kuwait Health Network
The Kuwait Scotland e-Health Innovation Network was formed in 2010 to improve care of chronic disease, with diabetes as an exemplar. Kuwait’s adult population has the sixth highest prevalence of diabetes in the world, affecting approximately 24% of the population. Informatics may be part of the solution to improve care. Aridhia built an informatics disease registry platform for primary health care clinics in Kuwait. The Kuwait Health Network (KHN) informatics platform was piloted in four primary health care clinics in Kuwait capital region. Diabetes care data was collated through KHN and care-mapped against the standard of care dictated by the Kuwait Standard and Clinical Guidelines. Regular semi-automated reports of diabetes prevalence, complication rates and care quality were created on a quarterly basis to inform individual clinics about their performance, in addition to a large annual survey. These reports were also be used by Ministry of Health and wider national bodies to decide on care priorities and resource allocation.
Data Examples from the Kuwait Health Network – Working Towards a Solution
Fully Automated Report
Two versions of the report can be generated:
- an individual clinic report . (You can find an example of an anonymised report here)
- an overall (all clinics) report. (You can find an example of an anonymised report here)
In addition to giving population and disease profiling, these reports also allow comparisons between different clinics and against the national averages for care parameters.
Population Profiling
Here we show further examples of population and disease profiling that is based on anonymised data from the Kuwait Health Network. Example descriptive summaries of the diabetes population: 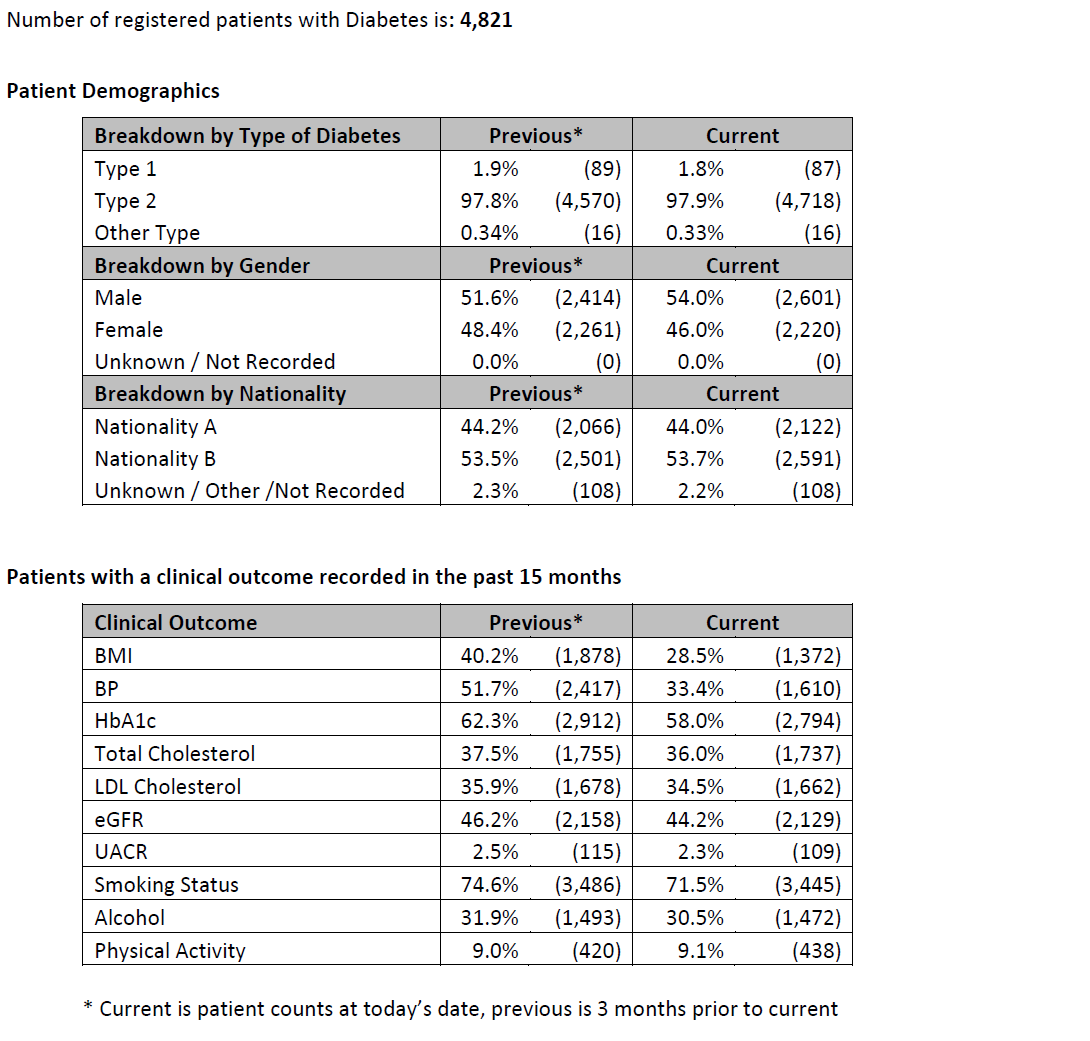 Example plot showing % of patients with Type 1 diabetes, split by age group:
 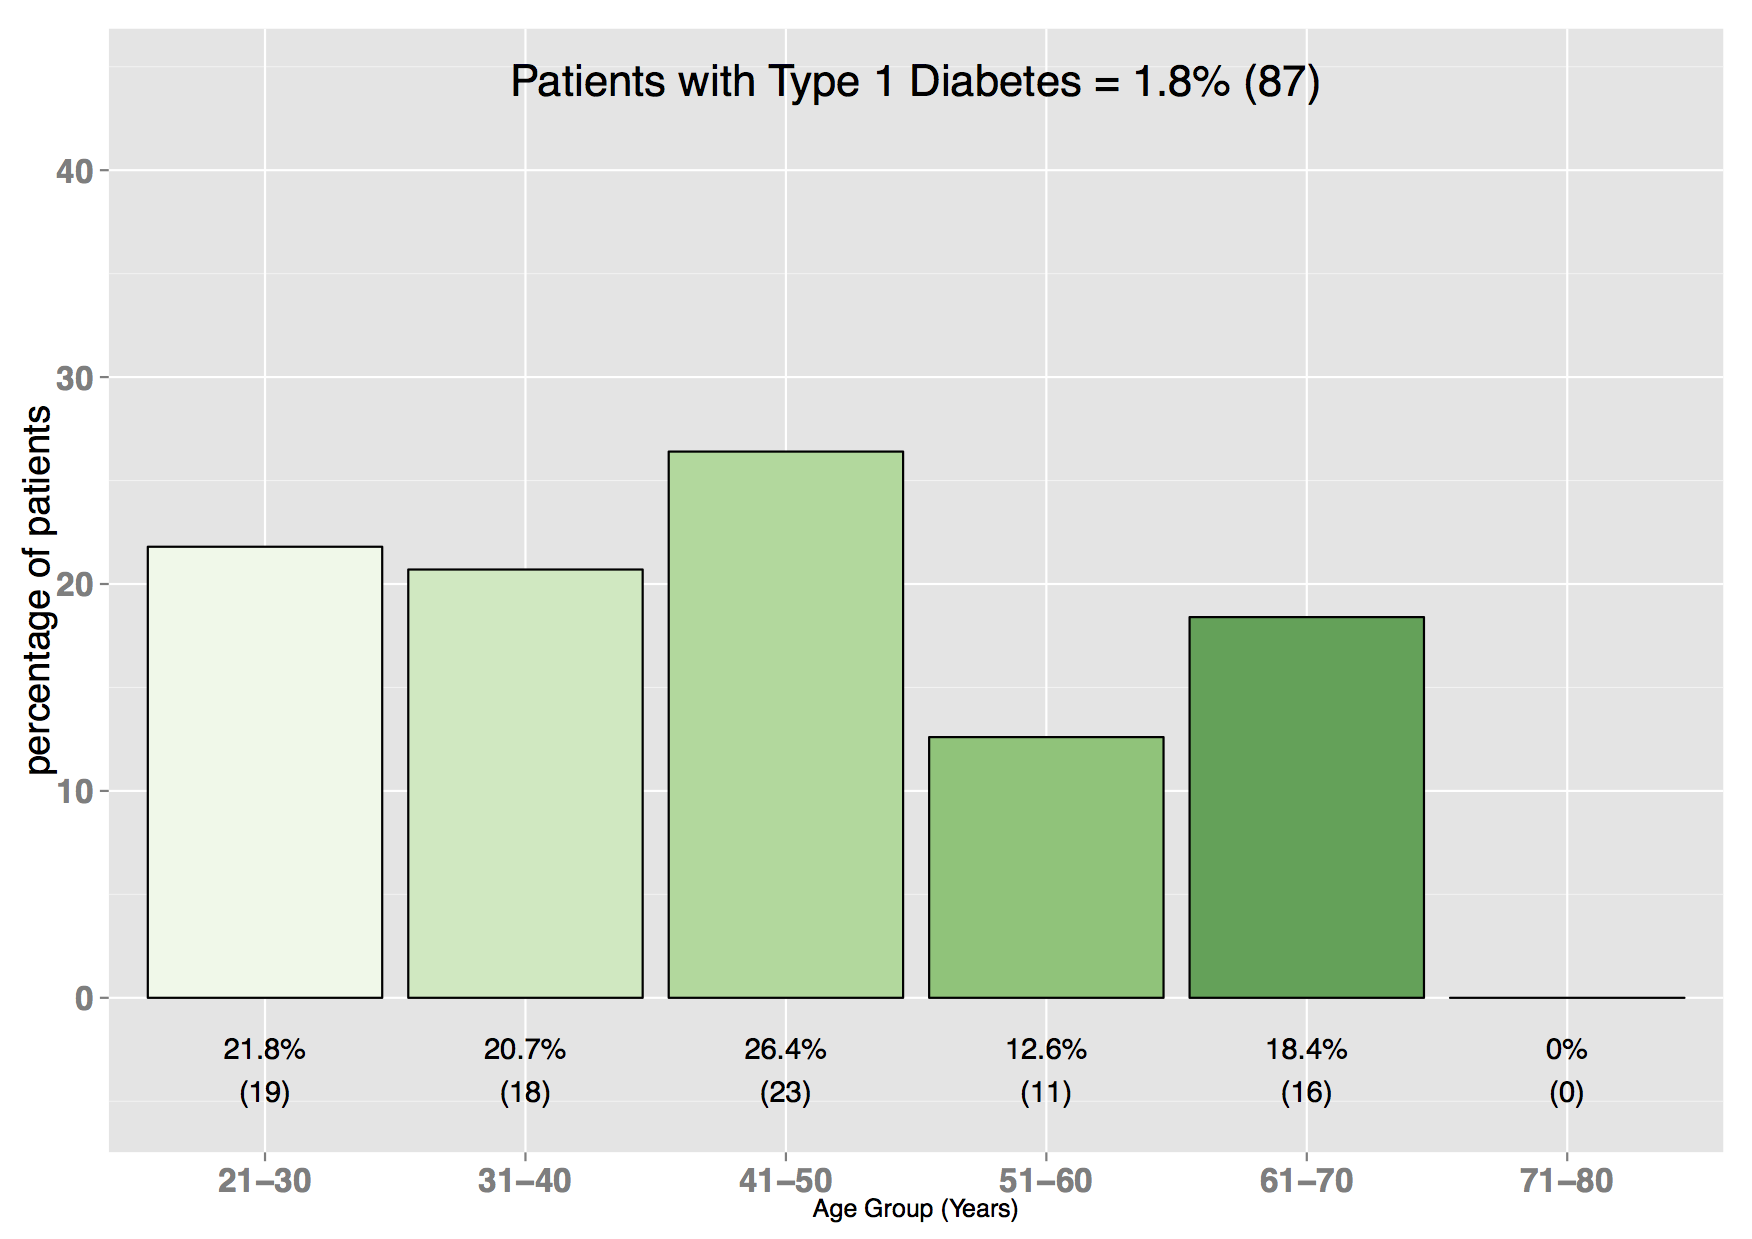 Example plot showing % of patients with Type 2 diabetes, split by age group:
 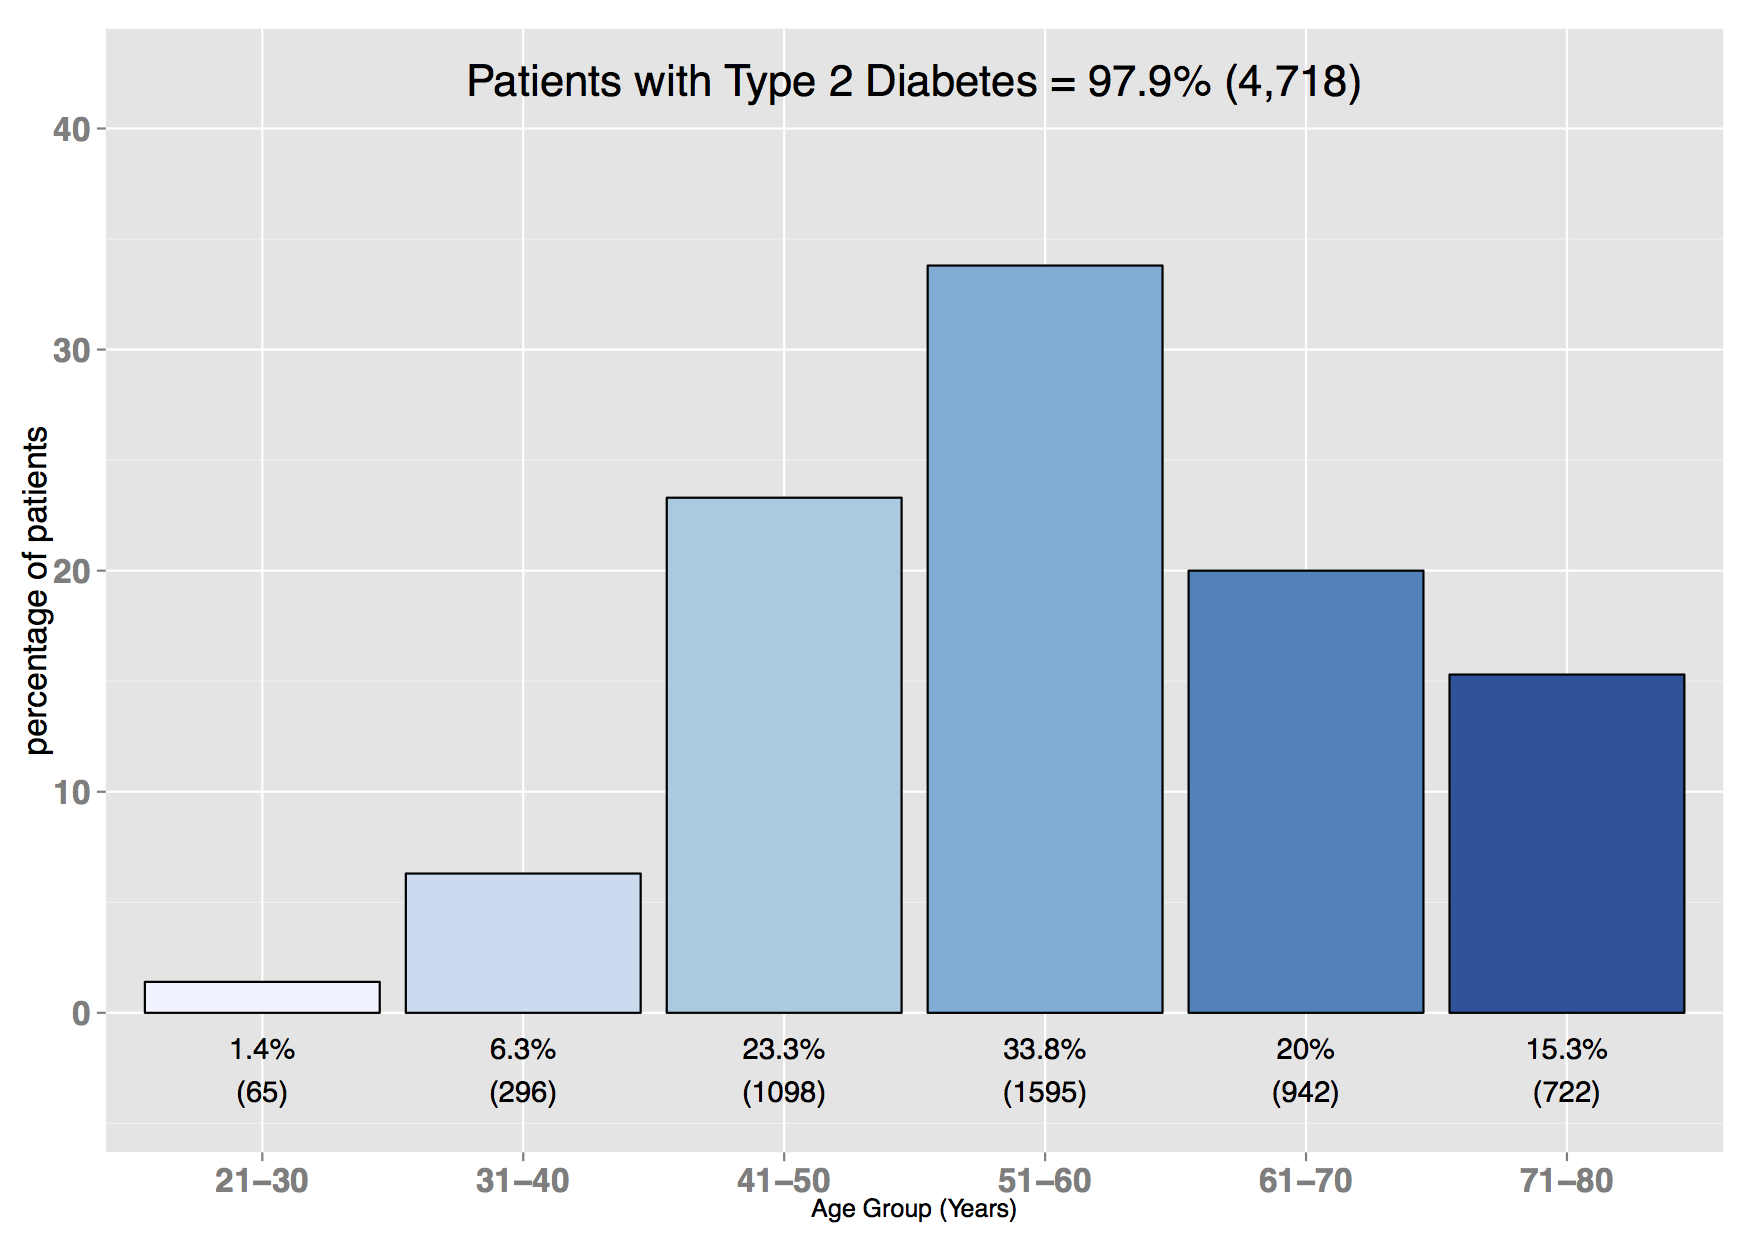 Example plot showing % of patients with a BMI recorded (within last 15 months), split by BMI categories:
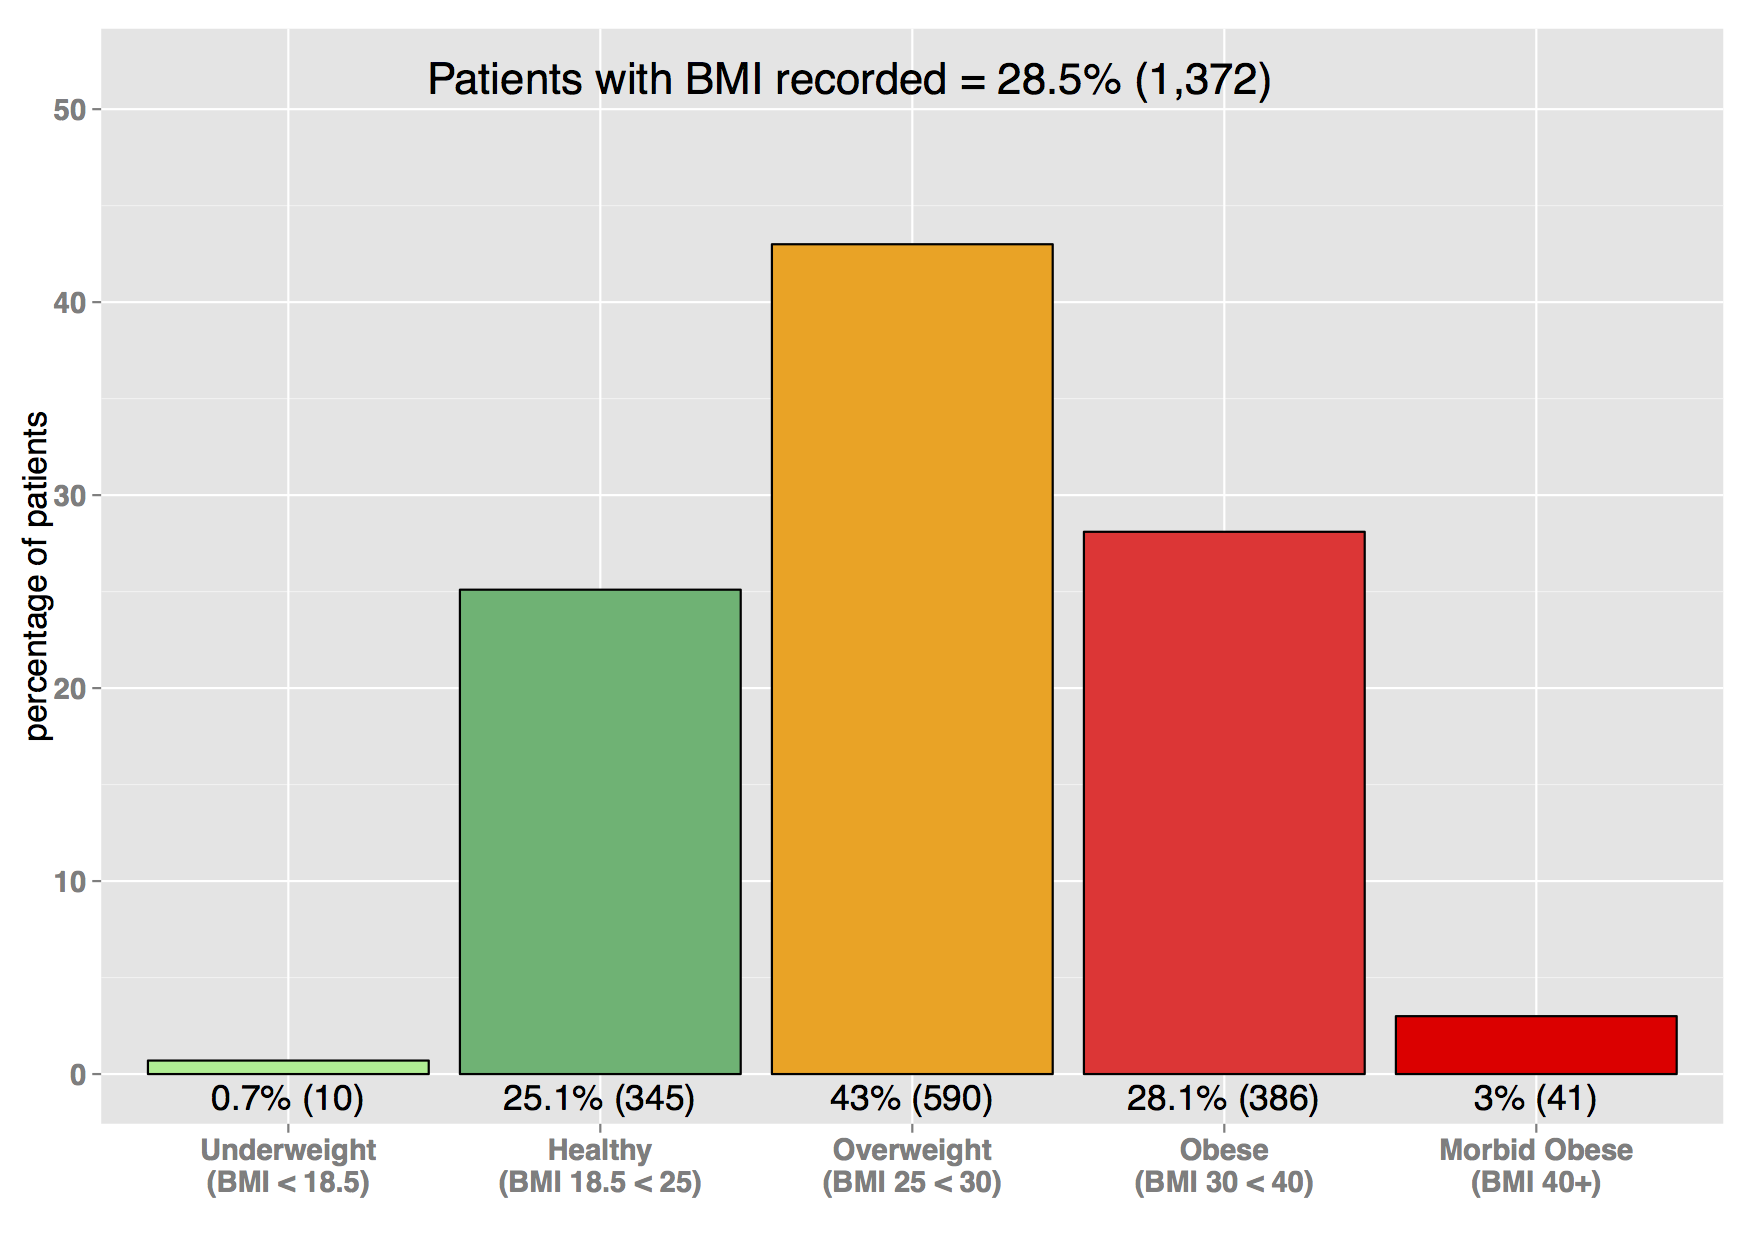
Disease Profiling
Disease profile reporting allows healthcare providers to track disease markers over time, and to make comparisons with national standards and guidelines, with other local healthcare providers, and with national averages.
Assessing Quality
Example: HbA1C (a long-term measure of blood sugar control) should be recorded on all patients at around six-monthly intervals. International guidelines suggest a target of around 7% (53mmol/mol) to reduce the risk of diabetes complications. Example plot showing % of patients with HbA1C recorded (within the last 15 months) and the comparison to target. (Note: Kuwait wanted to understand the breakdown in the very high bands): 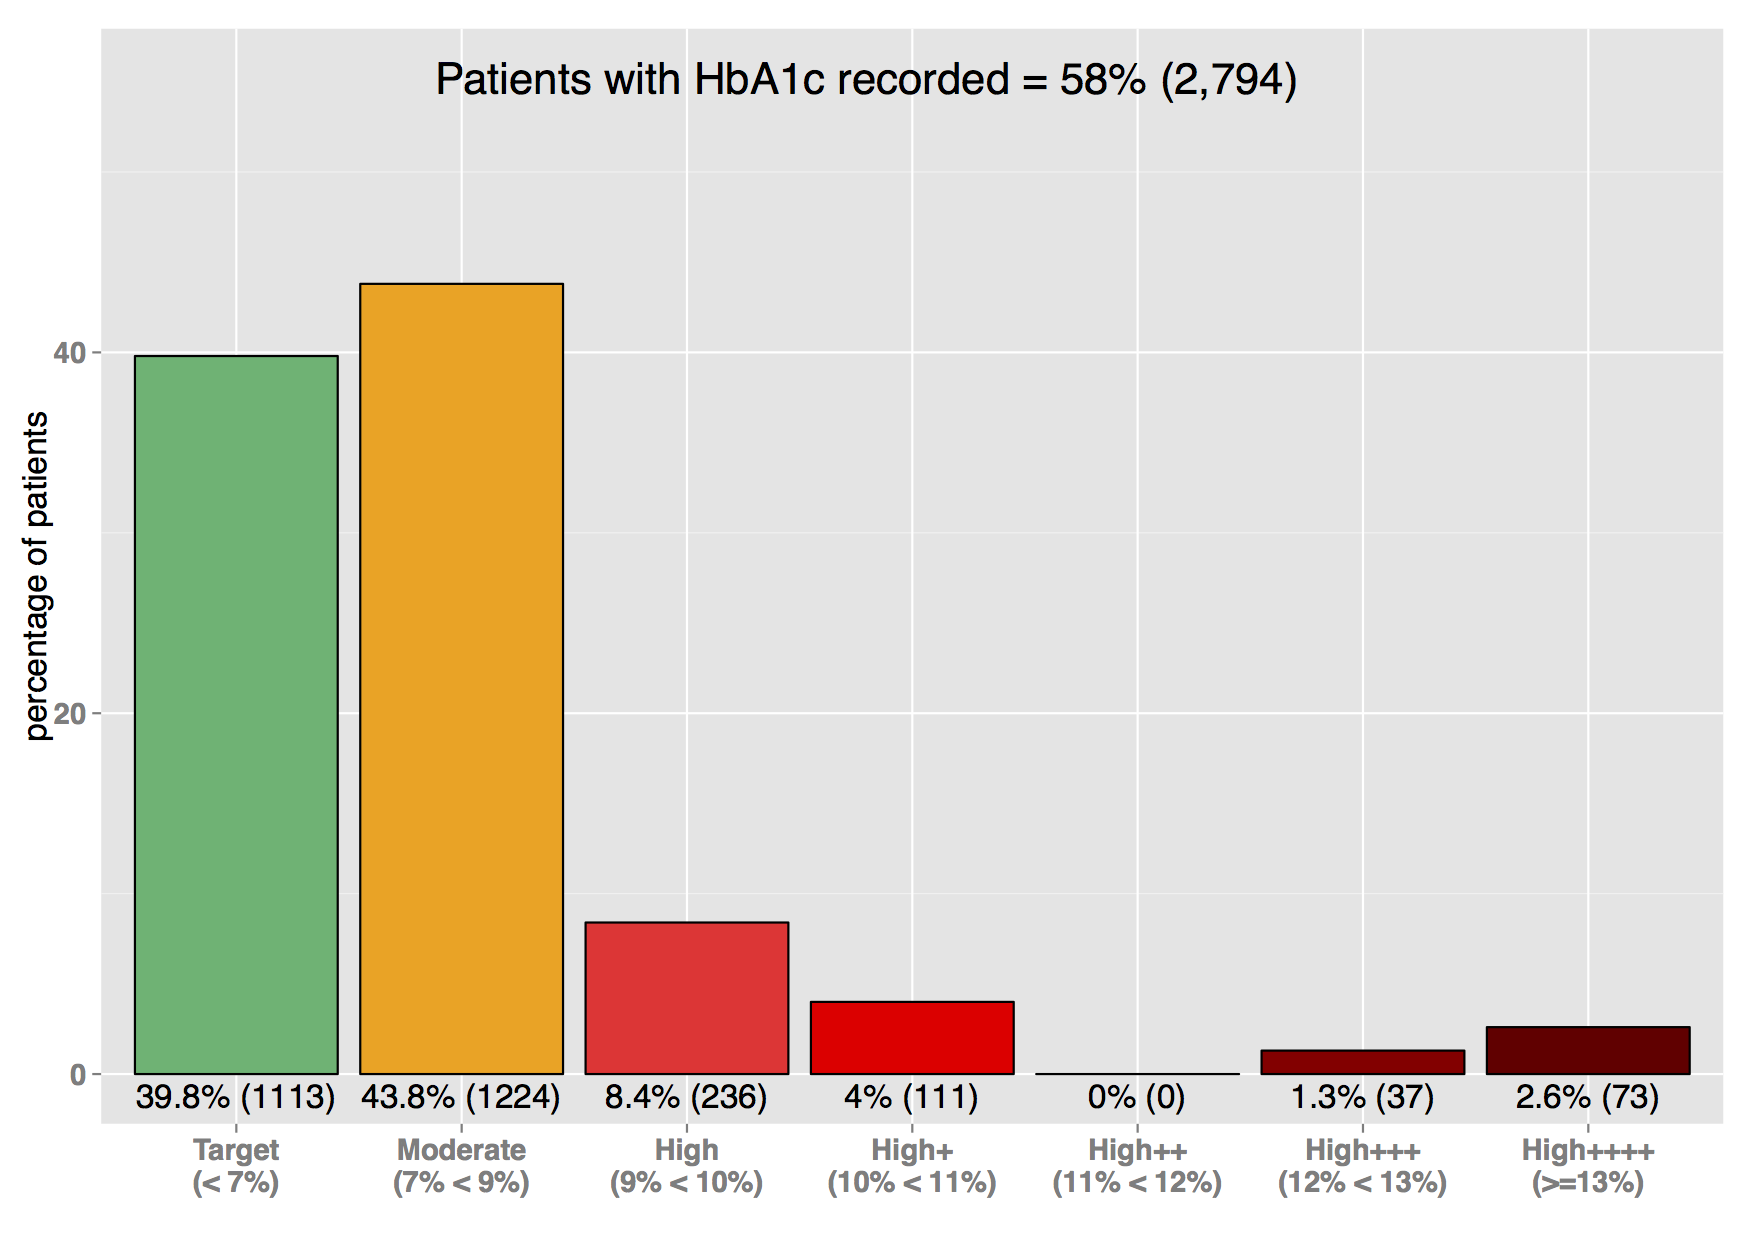
Assessing Improvement using Run Charts
Changes in parameters over time can be mapped using run charts; this is a useful tool for assessing quality improvement. The following charts show the different HbA1C categories over time. The dotted line represents the median based on the most recent 15 data points for each chart. 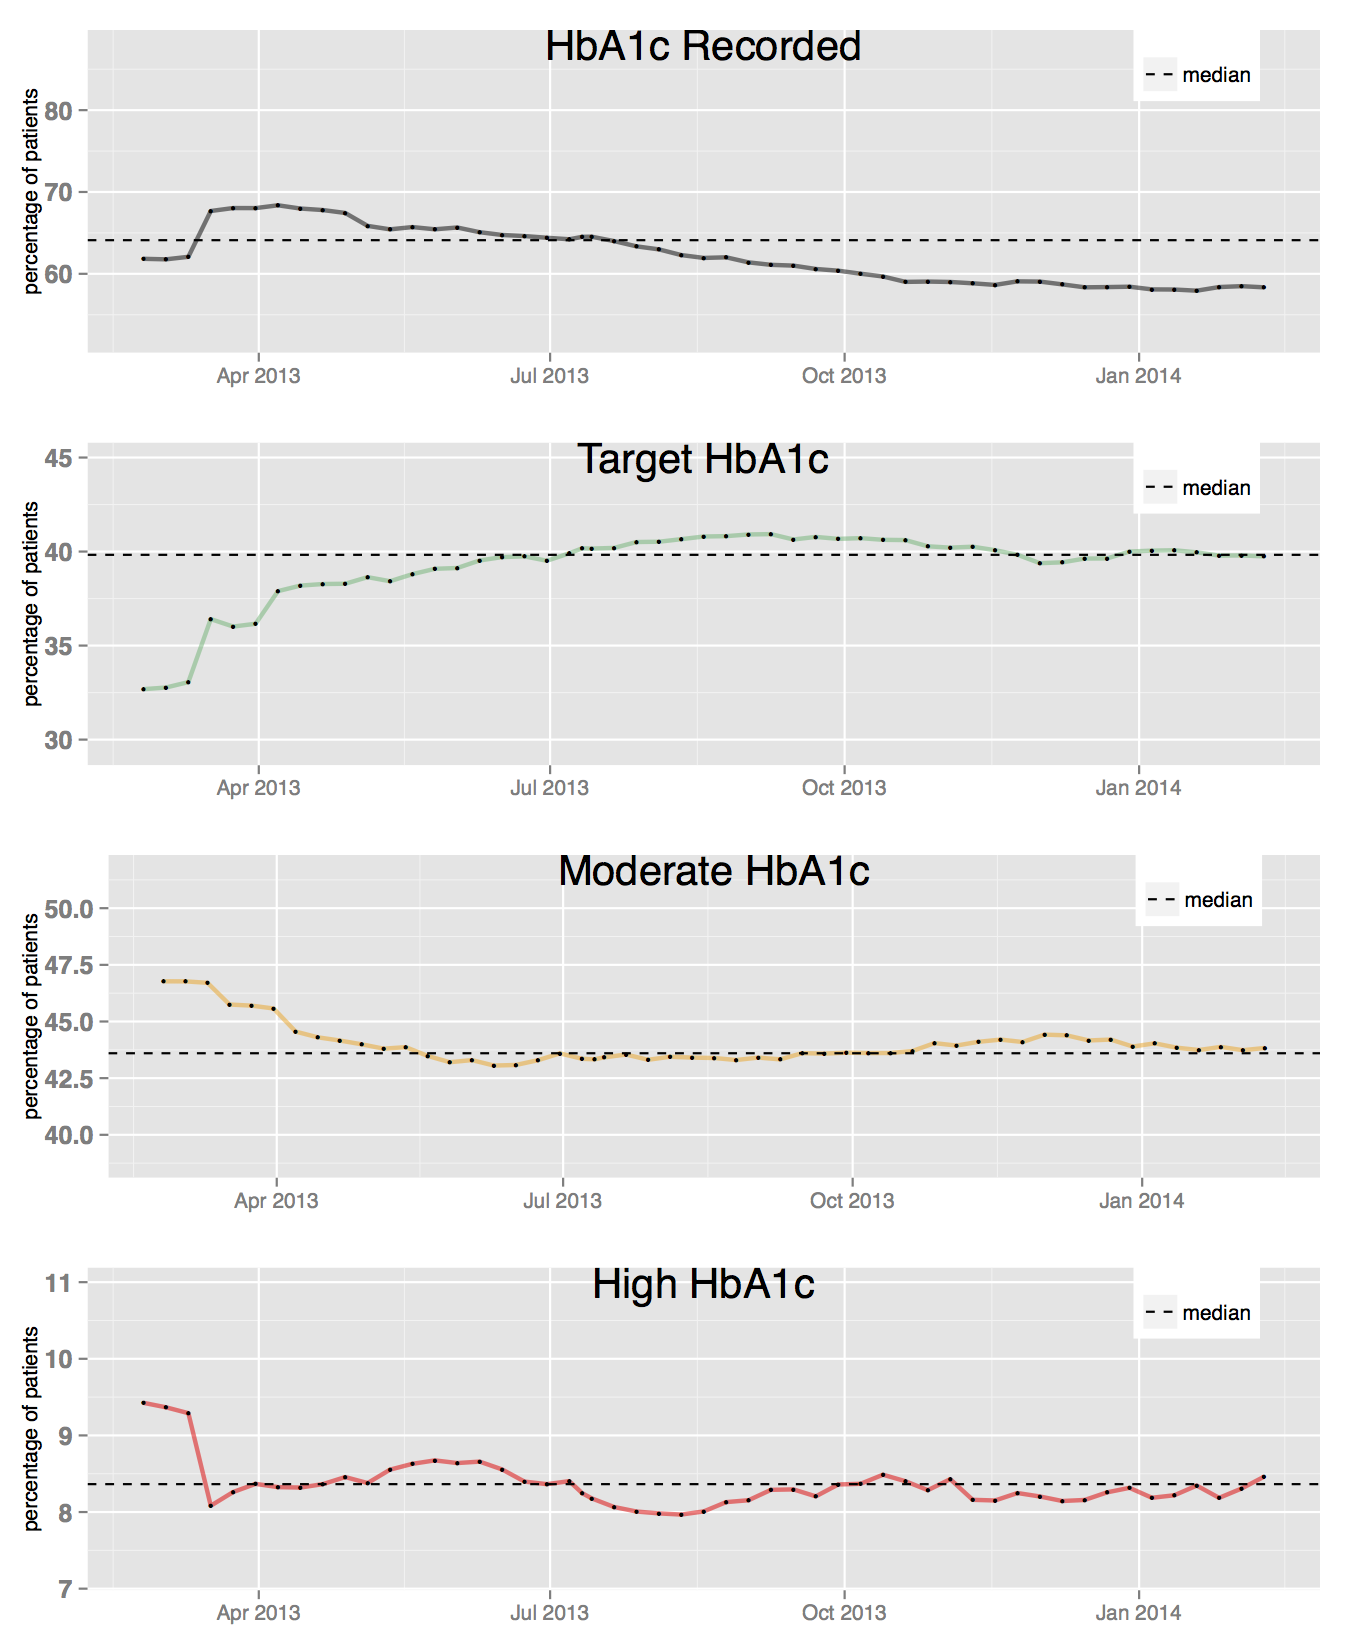
Comparing Performance
Comparing data with national averages and with other healthcare providers can be useful to determine deficiencies in care provision and allow for appropriate resource allocation, thus improving equity in care. Spine charts can be particularly useful for this type of data display. The following spine chart compares data for Clinic 1 against the national average for a defined list of metrics. The red dots show where it is doing worse than the national average; the green dots show where it is doing better than the national average. 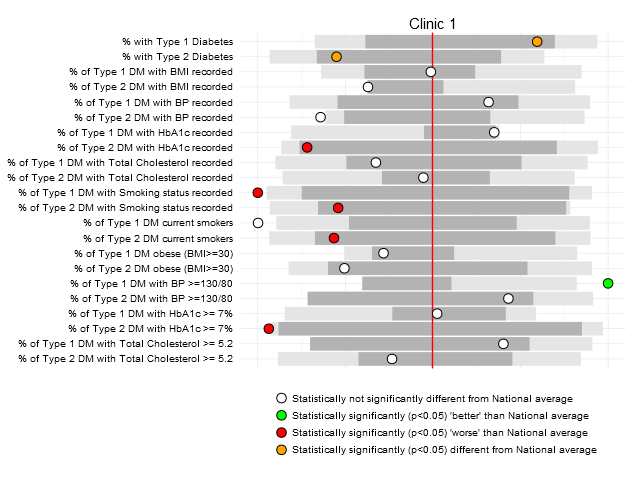 A useful link explaining how to interpret a spine chart can be found here:
Other such visualisations used for comparing performance can include GIS/map visualisations.
Discussion
The clear display of data in an appropriate format can help readers to quickly assimilate large amount of information. Options for data display may include bar graphs,line graphs, spine charts, and GIS/map visualisations. These can be combined into an auto-generated report as shown. Aridhia has developed scripts which will automatically calculate the key quality performance indicators (QPIs) for diabetes care using any dataset containing the appropriate fields. These scripts also produce a report (pdf) containing all these QPIs. The generation of these reports can be as frequent as data is refreshed, for example, daily or as required for team meetings, through to national reports (weekly, monthly, quarterly, yearly as required). Extracting a data set from a network of siloed data sources / systems can be complex, but turning that data into something meaningful can be transformational for healthcare. Here we’ve shown an example of a clear message being delivered from a large healthcare data set: this message identifies key parameters that dictate care delivery for chronic disease. Transforming future care provision will require many initiatives of this kind.
APPENDIX A.
Diabetes UK 15 Care Measures:
| Health Care Essential | Detail |
|---|---|
| 1 | Get your blood glucose levels measured at least once a year. An HbA1c blood test will measure your overall blood glucose control and help you and your diabetes healthcare team set your own target. |
| 2 | Have your blood pressure measured and recorded at least once a year, and set a personal target that is right for you. |
| 3 | Have your blood fats (cholesterol) measured every year. Like blood glucose levels and blood pressure, you should have your own target that is realistic and achievable. |
| 4 | Have your eyes screened for signs of retinopathy every year. Using a specialised digital camera, a photo of each eye will be taken and examined by a specialist who will look for any changes to your retina (the seeing part at the back of your eye). |
| 5 | Have your feet checked – the skin, circulation and nerve supply of your feet should be examined annually. You should be told if you have any risk of foot problems, how serious they are and if you will be referred to a specialist podiatrist or specialist foot clinic. |
| 6 | Have your kidney function monitored annually. You should have two tests for your kidneys: urine test for protein (a sign of possible kidney problems) and a blood test to measure kidney function. |
| 7 | Have your weight checked and have your waist measured to see if you need to lose weight. |
| 8 | Get support if you are a smoker including advice and support on how to quit. having diabetes already puts people at increased risk of heart disease and stroke, and smoking further increases this risk. |
| 9 | Receive care planning to meet your individual needs – you live with diabetes every day so you should have a say in every aspect of your care. Your yearly care plan should be agreed as a result of a discussion between you and your diabetes healthcare team, where you talk about your individual needs and set targets. |
| 10 | Attend an education course to help you understand and manage your diabetes. You should be offered and have the opportunity to attend courses in your local area. |
| 11 | Receive paediatric care if you are a child or young person. You should receive care from specialist diabetes paediatric healthcare professionals. When the time comes to leave paediatric care, you should know exactly what to expect so you have a smooth change over to adult health services. |
| 12 | Receive high quality care if admitted to hospital. If you have to stay in hospital, you should still continue to receive high-quality diabetes care from specialist diabetes healthcare professionals, regardless of whether you have been admitted due to your diabetes or not. |
| 13 | Get information and specialist care if you are planning to have a baby as your diabetes control has to be a lot tighter and monitored very closely. You should expect care and support from specialist healthcare professionals at every stage from preconception to post-natal care. |
| 14 | See specialist diabetes healthcare professionals to help you manage your diabetes. Diabetes affects different parts of the body and you should have the opportunity to see specialist professionals such as an ophthalmologist, podiatrist or dietician. |
| 15 | Get emotional and psychological support. Being diagnosed with diabetes and living with a long term condition can be difficult. You should be able to talk about your issues and concerns with specialist healthcare professionals. |
Appendix B.
Scottish Diabetes Survey (SDS) Metrics:
| Domain | Indicator Number | Indicator Detail |
| Prevalence, Incidence & Mortality | 1 | Age/Sex standardised prevalence of T1 Diabetes |
| 2 | Age/Sex standardised prevalence of T2 Diabetes | |
| 3 | Crude Prevalence of T1 Diabetes | |
| 4 | Crude Prevalence of T2 Diabetes | |
| 5 | Estimated % Population with undiagnosed Diabetes | |
| 6 | Crude mortality rate for all people with diabetes | |
| Quality of Recording | 7 | % of Diabetes pop with recorded BMI |
| 8 | % of Diabetes (T1) pop with recorded HbA1c | |
| 9 | % of Diabetes (T2) pop with recorded HbA1c | |
| 10 | % of Diabetes (T1) pop with recorded BP | |
| 11 | % of Diabetes (T2) pop with recorded BP | |
| 12 | % of Diabetes (T1) pop with recorded cholesterol | |
| 13 | % of Diabetes (T2) pop with recorded cholesterol | |
| 14 | % of Diabetes (T1) pop with recorded smoking status | |
| 15 | % of Diabetes (T2) pop with recorded smoking status | |
| 16 | % of Diabetes (T1) pop with recorded creatinine | |
| 17 | % of Diabetes (T2) pop with recorded creatinine | |
| 18 | % of Diabetes (T1) pop with recorded microalbumin | |
| 19 | % of Diabetes (T2) pop with recorded microalbumin | |
| 20 | % of Diabetes (T1) pop with recorded eGFR | |
| 21 | % of Diabetes (T2) pop with recorded eGFR | |
| 22 | % of Diabetes (T1) pop with recorded eye screen | |
| 23 | % of Diabetes (T2) pop with recorded eye screen | |
| 24 | % of Diabetes (T1) pop with recorded pulses | |
| 25 | % of Diabetes (T2) pop with recorded pulses | |
| 26 | % of Diabetes (T1) pop with recorded foot risk | |
| 27 | % of Diabetes (T2) pop with recorded foot risk | |
| Smoking | 28 | % of Diabetes pop (T1) current smokers |
| 29 | % of Diabetes pop (T2) current smokers | |
| Obesity & hypertension | 30 | % of Diabetes pop (T1) obese (BMI>=30) |
| 31 | % of Diabetes pop (T2) obese (BMI>=30) | |
| 32 | % of Diabetes pop (T1) with SBP <=140mmHg | |
| 33 | % of Diabetes pop (T2) with SBP <=140mmHg | |
| Metabollic Complications | 34 | % of Diabetes pop (T1) with HbA1c >75mmol/mol |
| 35 | % of Diabetes pop (T2) with HbA1c >75mmol/mol | |
| 36 | % of Diabetes pop (T1) with cholesterol > 5 | |
| 37 | % of Diabetes pop (T2) with cholesterol > 5 | |
| Microvascular Complications | 38 | % of Diabetes pop (T1) with eGFR < 15 |
| 39 | % of Diabetes pop (T2) with eGFR < 15 | |
| 40 | % of Diabetes pop (T1) withend stage renal failure | |
| 41 | % of Diabetes pop (T2) withend stage renal failure | |
| 42 | % of Diabetes pop (T1) with diabetic retinopathy | |
| 43 | % of Diabetes pop (T2) with diabetic retinopathy | |
| Macrovascular Complications | 44 | % of Diabetes pop (T1) with previous MI |
| 45 | % of Diabetes pop (T2) with previous MI | |
| 46 | % of Diabetes pop (T1) with previous cardiac revascularisation | |
| 47 | % of Diabetes pop (T2) with previous cardiac revascularisation | |
| 48 | % of Diabetes pop (T1) with previous stroke | |
| 49 | % of Diabetes pop (T2) with previous stroke | |
| 50 | % of Diabetes pop (T1) with previous foot ulcer | |
| 51 | % of Diabetes pop (T2) with previous foot ulcer | |
| 52 | % of Diabetes pop (T1) with previous lower limb amputation | |
| 53 | % of Diabetes pop (T2) with previous lower limb amputation |
References
- Diabetes UK. Diabetes. Beware the silent assassin. [Internet]. London; 2008. Available from: http://www.diabetes.org.uk/Documents/Reports/Silent_assassin_press_report.pdf
- National service framework: diabetes – Publications – GOV.UK [Internet]. [cited 2014 Feb 27]. Available from: https://www.gov.uk/government/publications/national-service-framework-diabetes
- Hex N, Bartlett C, Wright D, Taylor M, Varley D. Estimating the current and future costs of Type 1 and Type 2 diabetes in the UK, including direct health costs and indirect societal and productivity costs. Diabet Med J Br Diabet Assoc. 2012 Jul;29(7):855-62.
- Scottish Diabetes Survey Monitoring Group. Scottish Diabetes Survey 2012 [Internet]. Available from: http://www.diabetesinscotland.org.uk/Publications/SDS%202012.pdf
- Scottish Government SAH. Diabetes Action Plan 2010: Quality Care for Diabetes in Scotland [Internet]. 2010 [cited 2014 Feb 27]. Available from: http://www.scotland.gov.uk/Publications/2010/08/17095311/0
- Scottish Government SAH. Delivering for Health [Internet]. 2005 [cited 2014 Feb 27]. Available from: http://www.scotland.gov.uk/Publications/2005/11/02102635/26356
- Scottish Intercollegiate Guidelines Network. SIGN 116. Management of diabetes; A national clinical guideline [Internet]. NHS Quailty Improvement Scotland; 2010 Mar. Available from:
- NICE. Search Guidelines [Internet]. NICE. [cited 2014 Feb 27]. Available from: http://www.nice.org.uk/
- Diabetes UK 15 Care Measures. Available from: http://www.diabetes.org.uk/15-essentials
- Schofield CJ, Yu N, Jain AS, Leese GP. Decreasing amputation rates in patients with diabetes-a population-based study. Diabet Med J Br Diabet Assoc. 2009 Aug;26(8):773-7.
- Quality Outcomes Framework. Available from: https://isdscotland.scot.nhs.uk/Health-Topics/General-Practice/Publications/2013-09-24/2013-09-24-QOF-Report.pdf?82059878111
- A summary of QOF guidance. Available from: http://bma.org.uk/practical-support-at-work/contracts/independent-contractors/qof-guidance
- Vallance JH, Wilson PJ, Leese GP, McAlpine R, MacEwen CJ, Ellis JD. Diabetic retinopathy: more patients, less laser: a longitudinal population-based study in Tayside, Scotland. Diabetes Care. 2008 Jun;31(6):1126-31.