Blogs & News
Measuring the Impact of Data Sharing Platforms
It has bothered me for years now: How do we truly measure the impact of data sharing platforms? I have seen many organisations, without pausing to define what success really looks like, employ tried-and-true business metrics to describe ‘goodness’ of data sharing platform projects. Maybe that’s the right approach, and maybe it is not.
It makes sense to try and quantify things when we attempt to measure success. As a data scientist, I love numbers, and a counting approach makes sense to me on a superficial level. But quantifying some things is challenging and has a limited ability to tell us what we really want to know. For example, in medicine, we ask patients to turn their subjective experience of pain into a number between one and ten. And sure, that helps us to know when a patient is feeling subjectively better or worse after interventions. But it does not account for the fact that patients experience pain in ways that are probably not on the same scale. I recall being in the throes of childbirth without pharmaceutical pain interventions and I could only go up to an eight when asked. I laugh at this now, but I distinctly remember a nurse asking me “Are you sure this is not the worst pain imaginable?” to which I replied something like, “I have a pretty great imagination.” Conversely, I once heard a Texas college football linebacker screaming in such pain at a health clinic that I was sure he had lost a limb (maybe he had to chew it off?) but when a nurse coworker came out of the room, she explained they were treating an ingrown toenail.
All of this is not to criticise pain management (or even to make fun of footballers), but simply to highlight that we must acknowledge the limits of our metrics and be careful not to rely too heavily on a number as the only thing that matters. Qualitative measures can add resolution to a grainy picture. Let us start with a tour of oft-used metrics that are used to report impact to grant funders and budget managers and talk about their limitations as well as some complementary assessments.
Is it with data?
Do we use data metrics as a surrogate measure for the impact of a data sharing platform? If so, is it counts of datasets that matter? Counts of patients within those datasets? Or is it just the sheer number of variables that we are concerned with – maybe how much disc space is needed to store them? I have seen counts of datasets, variables, and patients used quite commonly, and I have found myself wondering how much that truly relates to the platform’s impact.
“And surely, we have learned by now that large volumes of questionable data are not a replacement for a few well-curated and high-quality datasets.”
At best, it tells me that a platform has a lot of data available. And surely, we have learned by now that large volumes of questionable data are not a replacement for a few well-curated and high-quality datasets. My next question, after seeing that a platform hosts a large quantity of data, is always about the quality of that data and its relevance to my potential scientific analyses.
So, what about longitudinality of studies, or the presence of quantitative variables, or even better – quantitative variables measured consistently over time? I will need to do some basic exploration of the variables to assess both data quality and its relevance to my needs. Library of Congress provides some metrics for measuring data quality here and justifiably points to the importance of metadata for preserving data’s usefulness in secondary analyses.
Aridhia’s FAIR Data Services allows users to review variables and detailed metadata, including study design and sample case report forms, for example. And our Cohort Builder, which is a current focus of our development and product teams, allows users to explore things like missingness, data types, and domains of values before investing time in requesting access to data that may not inform an analysis. I cannot be the only scientist who has built an analysis plan and gone through months of a data access request negotiation, only to find that the variables of interest were mostly left blank or contained free-text comments without any enforcement of domains or data type rules. Cohort Builder aims to prevent wasted effort where possible. We believe that empowering the end user to assess quality and relevance of data, and not just providing counts of records, is crucial to a high-impact data sharing platform.
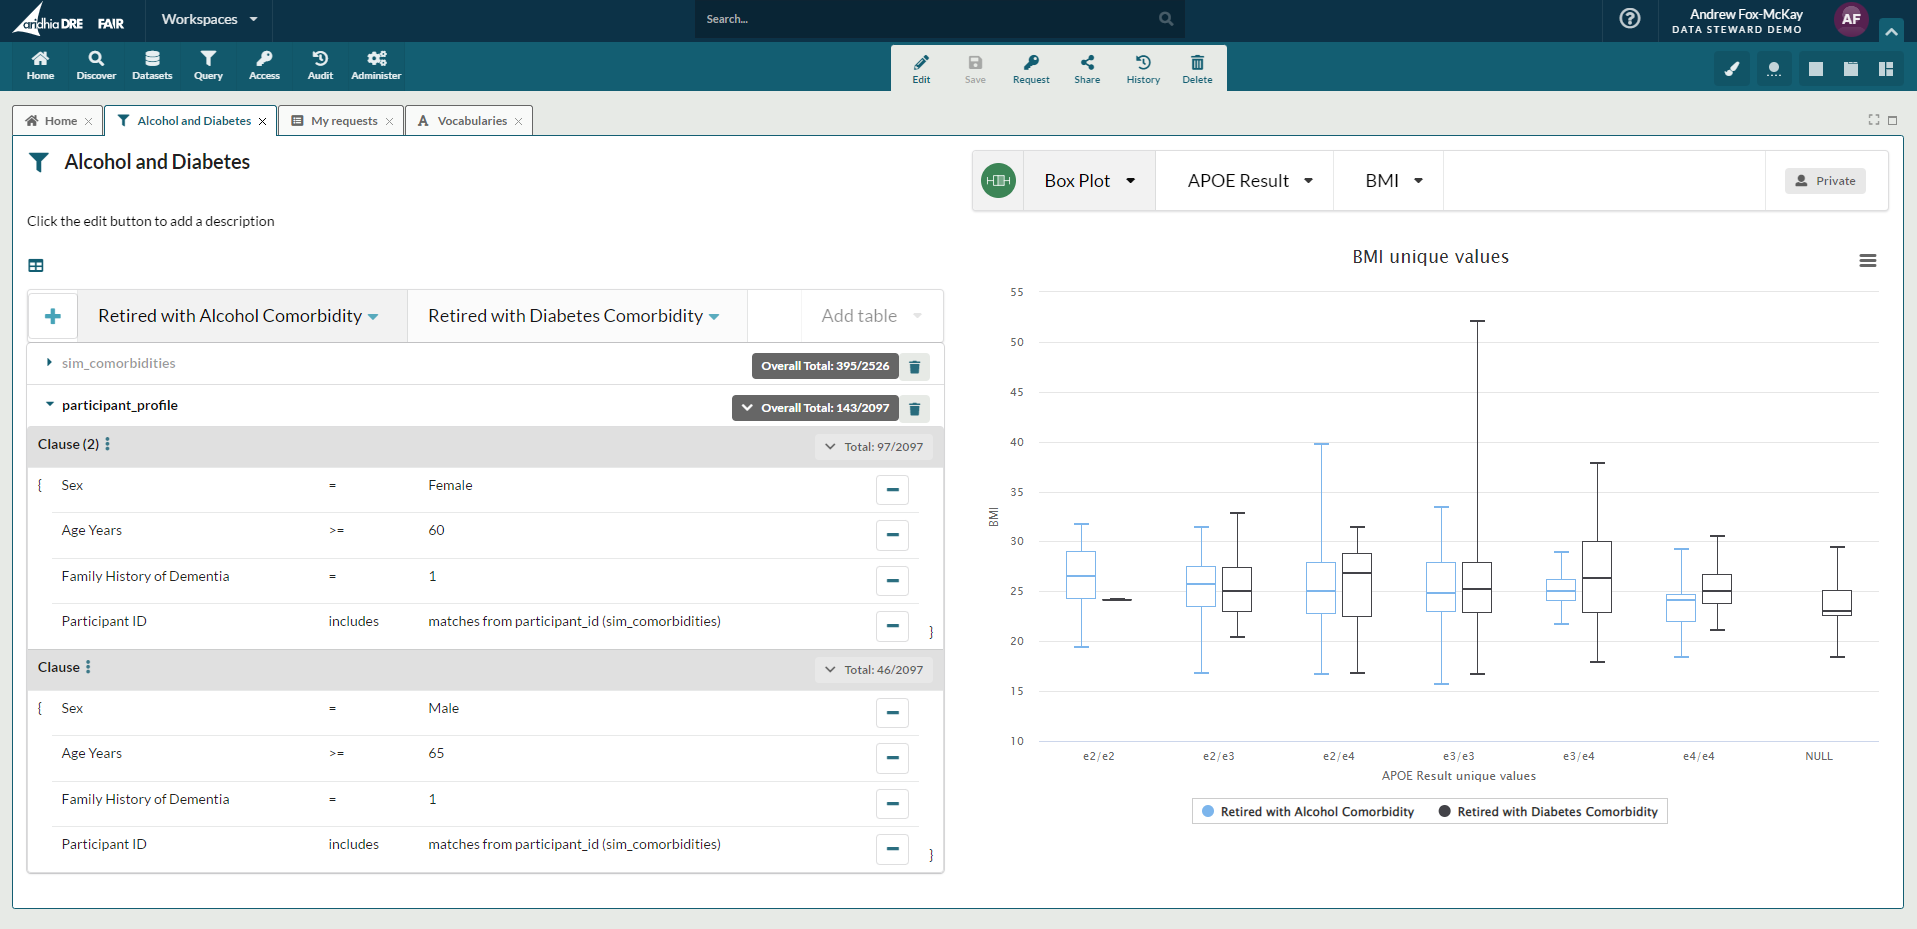
The new Cohort Builder for FAIR Data Services
Is it with users?
Another commonly used metric borrowed from business is a key performance indicator, or KPI, that attempts to track users and clicks. But clinical research and drug development organisations are not social media companies, where the amount of user traffic tends to provide a helpful assessment of potential advertising revenue. What about measuring the diversity of users, such as a good representation of all phases of the research life cycle, or enrichment for targeted groups of users? All of these are worth monitoring to assure that your platform attracts targeted users, but does a count of users tell a real story about impact? What if they request an account but then fail to follow up?
The Aridhia DRE (Digital Research Environment) allows a platform administrator to additionally track how many times users request a workspace to securely view, edit, and analyse data. If a user requests a workspace, they have gone beyond reviewing metadata and have requested patient-level data for a deeper look. This is a helpful step toward measuring user activity, and not simply basic user counts. But if we explore more deeply beyond ‘good’ counts of users – whatever that number (a whole separate topic!) – we need to ask ourselves whether we care about user personas.
Are we concerned with users who consume data? What if none of the users conversely share data? And do we have users building tools or statistical models to share? In other words, if we hope to measure impact, don’t we actually care about the outputs of the users more than the sheer numbers of users? This leads me to the next category of metrics.
Is it with outputs?
You might have noticed that the metrics so far are measured from the perspectives of data platform owners who aim to brag, “Look at all these data!” or, “We have lots of impressive users.” My personal perspective is that those metrics do play a role, as I explained above, and I have been on the hook to report them. But in discussing impact with grant funders and external collaborators, people have suggested to me an array of project outputs that come from impactful data platforms. Academicians sharing data have insisted that publications are the ultimate product of powerful data sharing initiatives. Perhaps unsurprisingly, some consumers of data have told me the only thing that matters are the statistical models that are derived from the data. And really smart data scientists have told me that a data sharing platform can be judged by its data FAIRness. My response to all these perspectives is, “Yes, and….”
Linking publications to data sharing platforms is more challenging than new platform architects often realise, and most people rely on the honour system. But we can do better, and we have. In addition to allowing data owners to specify terms and conditions that include an expectation of a citation in publications, Aridhia’s DRE is working on integration of DOI references so that novel data subsets may be cited and shared with unique identification. Data consumers might make changes to a data set like recalculating a derived variable for a single study using a different formula, or they might aggregate a subset of variables from multiple studies, and a unique DOI will help trace the original data through to publications. This feature enables better reproducibility and provides a more direct link between publications and the data platform.
“Linking publications to data sharing platforms is more challenging than new platform architects often realise, and most people rely on the honour system. But we can do better, and we have.”
My experience with sharing tools is similarly deceptive in its superficial simplicity. Has anyone else authored an open-source set of scripts, only to become tech support for people who do not have the right R or Python modules or specific software packages? That is not intended to slight people I have shared with because it becomes a real time sink when new versions and modules come out all the time and users have various IT policies. At Aridhia, we have supported quantitative scientists by enabling them to share statistical models via DRE Workspaces in a couple of ways that bypass that hassle. Modelers can perfect scripts in a workspace along with supporting data and invite others to join them privately and securely. If a broader audience is expected, modelers may choose to containerise an R web app that users may request in their own workspaces and even bring their own data to inform and refine that model. And best of all, both methods enable platform owners to make note of how often a model is requested and the types of users accessing them. Modelers might disagree with me and say the best part is that they can carry on with more modeling instead of being pro bono software support technicians.
Regarding FAIRification of data, I have already mentioned our FAIR Data Services. Lots of smart people have tried building metadata catalogues with mixed results, and it makes sense to invest in a shared resource so that we all benefit from evolving together, because it is hard to get this right. There are some things we do not give much thought unless they do not get done, and maybe we underestimate how hard those invisible labours might be. Like how many of us really learned to appreciate teachers during the Great Homeschooling Experiment of 2020, people really notice when data lacks meaningful reusability components like data dictionaries. Aridhia has worked hard to provide prompts and fields for adding metadata and to build findability with keyword searches, and we are working on even better faceted searching. But the truly pivotal piece that often gets missed? We successfully connect the metadata with the actual data so that users can find and access data in the same workflow. I wonder how often the spark of a great idea gets extinguished because users are frustrated that they have searched and found, only to be told they must separately contact the data owner and start bespoke negotiations for access. To me, mitigating the risk of a lost discovery is an impactful thing.
What have we missed?
A category of impacts that often gets overlooked are those which are harder to document with tangible evidence, but they are worth discussing. For data sharing platforms that aim to store or connect with all data in a disease area, for example, we might fail to think about the studies that get designed and funded because the platform reveals a strategic gap in scientific knowledge of a disease. If the data sharing platform exists to help bring a community together around a common goal, then providing an inventory of what has been done and what remains is impactful. Users might log into your platform, review all data and variables, and walk away. That is not necessarily because your platform was insufficient, right? I am often thinking about ways to measure those interactions. Is it with user surveys? I have not found the perfect answer yet, and I would love to hear your ideas if you have them.
And along the same vein of bringing communities together, what about collaborations enabled or ideas sparked by activities of other users? Our Workspaces team is building an inventory of workspaces and summary data for broadcast so that people around the globe can be connected more easily. The nature of providing secure and private workspaces to strictly control access to data can make a platform feel too private if no one can see what is happening. We’re imagining a scenario where people can see just enough information about analysis activities that they are inspired to reach out to workspace members to share notes and form new collaborations. Maybe you discover that a separate drug discovery team in your organisation is studying a similar therapeutic area with complementary data for your disease, but you did not know those efforts overlapped with yours. Breaking down silos is really impactful.

And the one that comes to mind for any data sharing effort that hosts patient data: How many data leakages were prevented? And if you have followed best practices and had an incident, it is nice to know that you have proof that you made the best possible effort to avoid the worst. Homegrown platforms sound great until the time and cost are calculated for validating patient data privacy and security. That’s why Aridhia has spent several years attaining key certifications including ISO/IEC 27001 for information security management, ISO/IEC 27701 for GDPR privacy information management and the HITRUST security and privacy framework. Achieving these certifications needs a significant organisational investment, requiring dedicated FTEs and six figure sums of money. Even with a mature information security management system and an ISO 27001 certification already in place, Aridhia spent a further 18 months of dedicated effort in achieving HITRUST to certify HIPAA compliance. Providing certifiably secure access to high-risk data is a worthwhile measure of impact.
Yes, and…
Now let us circle back to my initial point about defining what success looks like. If we go beyond measurements of activity like counts of data sets acquired and users recruited, we start to see the results of that activity in outputs like publications and drug development tools such as disease progression models. What if none of those move you closer to your ultimate goal?
Let us say your research platform is buzzing with new publication references. Did the data sharing platform get built so that researchers’ careers could be boosted, or is that just a nice side benefit? If your organisation is doing clinical research, isn’t your ultimate goal to improve the lives of the patients you serve? I think a fantastically good example of this lies at Great Ormond Street Hospital in London, where findings from research are being leveraged in clinical practice with help from the Aridhia DRE.
And if your organisation is doing pharmaceutical development, do you measure success by how many models your staff produce? Or do you measure success by how many new or improved treatments you get to market? In that case, modeling work is only impactful if it removes some obstacle preventing innovation or alerts you to effectiveness of your products in real-world populations. We were proud to support the Grand Challenges International COVID-19 Data Alliance (ICODA) COVID-19 Data Science Initiative by providing the secure Aridhia DRE to participants, and I think monitoring effectiveness of vaccines in Brazil was a good example of this kind of impact.
My personal perspective is that success for all these data sharing efforts is measured by how many patients’ pathologies are better diagnosed, treated, cured, or even prevented. If that’s what success looks like, then impact is measured by all of the things that remove roadblocks to bring research findings to the clinic faster, move new therapeutics to markets more efficiently, and bring the patient’s voice to the front of your community’s mind in a secure, trustworthy way.