Blogs & News
Risk Stratification: Reducing the Risk of Readmission within 30 Days
It was announced under government plans in 2010 that hospitals will face financial penalties if patients are readmitted as an emergency within 30 days of being discharged. It was revealed on Channel 4 Dispatches in February 2014 that more than 390 million pounds (£390,477,765) has been withheld from English hospital budgets under this readmissions policy since 2011. Following this announcement the PARR-30 predictive model has been developed by the Nuffield Trust to predict which in-patients are at risk of readmission within 30 days of being discharged. Patients may be further classified as being of low, medium or high risk of being readmitted.
Read all about how Aridhia have implemented this model into a free, easy-to-access app or, try PARR-30 out on our community site to apply the app to your local NHS trust.
Aridhia’s data science team created a visualisation showing the predicted classification of 200 patients from a sample dataset, synthetically created by Aridhia. Each row corresponds to a unique patient who has been discharged from hospital and contains a field which informs if there was an emergency readmission within 30 days of discharge or not. Using the sample data we calculated the predicted risk of readmission within 30 days using the default original PARR-30 coefficients. From this predicted risk score we classified a patient as being at risk/not at risk of readmission within the next 30 days. We chose a threshold of 0.5 where a patient with a risk score of greater than 0.5 was classified as being at risk of readmission; if less than 0.5 then classified as not being at risk of readmission. We also used the risk score to further classify each patient as being of low, medium or high risk of readmission within the next 30 days. The banding for this was set as a default but can be changed by the user:
- score < 1/3; low risk
- 1/3≤ score < 2/3; medium risk
- score ≥ 2/3; high risk
We compared the predicted classifications versus the actual risk score results. We are interested in:
- True Positive: percentage of patients who were predicted to be readmitted and were readmitted
- False Positive: percentage of patients who were predicted to be readmitted but were not readmitted
- False Negative: percentage of patients who were predicted to NOT be readmitted but were readmitted
- True Negative: percentage of patients who were predicted to NOT be readmitted and were not readmitted
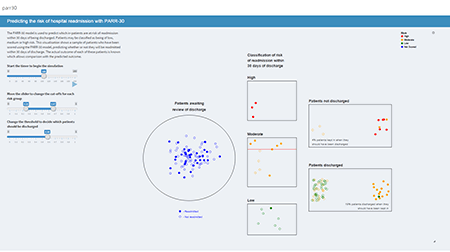
Starting the simulation you can see:
- whether patients were predicted to be readmitted or not readmitted
- whether patients were classified as a low, medium or high risk
- the percentage of predictions that were incorrect (false positive and false negative)
Try running this visualisation to see how the PARR-30 mini-app could process your data. We took inspiration from this great visualisation exploring how risk assessment affects prisoner release in a parole simulation. Take a look here.