Supporting OMOP in a Trusted Research Environment
What is the OMOP CDM?
The Observational Medical Outcomes Partnership Common Data Model (OMOP CDM) is an open source standard for harmonising health care data. Common data models are not a recent development, but as mentioned in one of our previous blogs, data models in general and OMOP in particular, appear to be reaching a critical mass of adoption. We see this both as a wider trend within the health data domain, but also directly with our existing partners and projects. In this blog we examine how the Aridhia DRE can help data owners adopt the OMOP CDM, and how available Aridhia DRE Community apps can help researchers work with the data productively in a secure workspace.
OMOP Tooling – harmonising Data
OHDSI provide a variety of open source tools for mapping and working with OMOP data. Our work with the Sydney Children’s Hospital Network, showed how these could be used in conjunction with the Aridhia DRE.
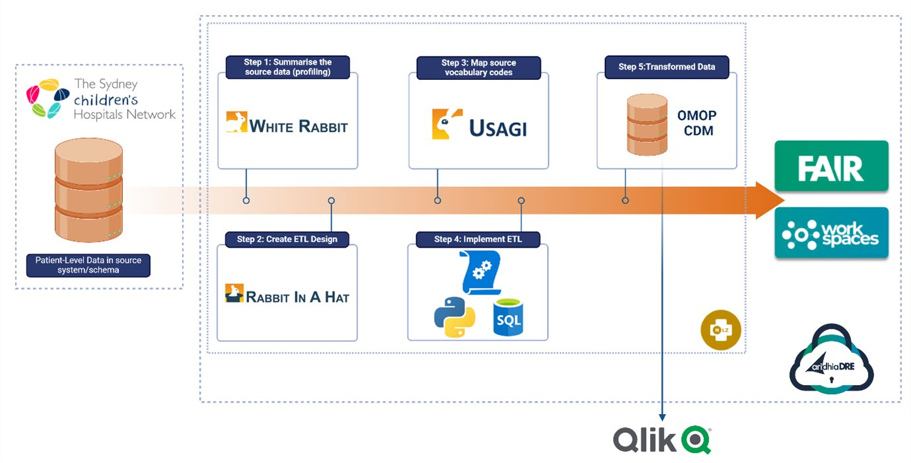
Transformation of SCHN data into the OMOP model was ingested into a secure data area within the DRE. Controlled access was provided through a virtual private network (VPN), ensuring security and deployment management consistency. Data from the on-premises data lake was de-identified and pushed into the HLZ storage account daily. From there, it was moved into a suitable database where OMOP tools were used (WhiteRabbit, Rabbit-In-a-Hat and USAGI) to map and then create an ETL pipeline to output the data into an OMOP database.
FAIR Data Services – managing and validating Data
FAIR is Aridhia’s metadata catalogue, allowing data owners to easily manage their data holdings and make them findable and accessible to researchers. The recently introduced FAIR Data Models feature makes it easier than ever to manage OMOP data within FAIR.
FAIR data models allow data owners to identify which data model their dataset uses (e.g OMOP), and allows researchers to search and filter for datasets which use a particular data model.
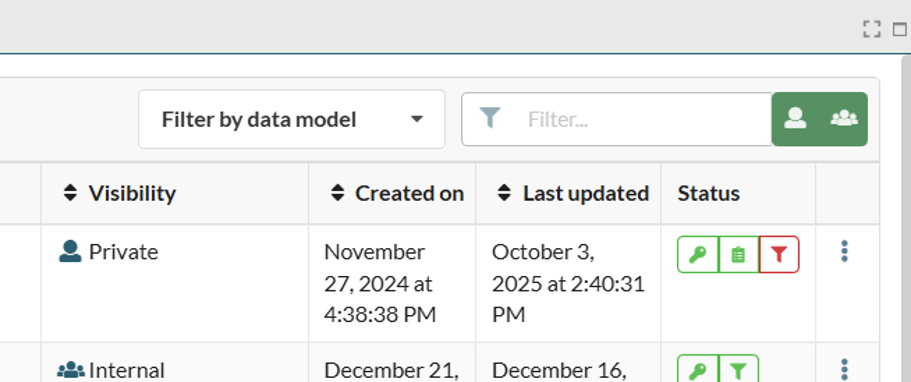
Hub owners can manage the available data models within FAIR, including adding their own. Additionally, they can add validations to the models, these produce a report for the data owner confirming if the dataset metadata adheres to the structure of the data model they are using.
Out of the box FAIR provides curated data models for OMOP and the Study Data Tabulation Model (SDTM). The curated OMOP data model comes with a four level validation report:
| Validation | Description |
|---|---|
| Basic | All OMOP CDM dictionaries are present, non-OMOP dictionaries may exist in dataset. |
| Bronze | All OMOP CDM dictionaries are present and contain expected columns, non-OMOP dictionaries and columns may exist. |
| Silver | All OMOP CDM dictionaries and columns are present, no additional dictionaries or additional columns allowed, column types are not checked. |
| Gold | All OMOP CDM dictionaries and columns are present, no additional dictionaries or additional columns are allowed, column types must be correct. |
This report is not visible to standard users, but is provided to the data owner as a downloadable markdown file.
Workspaces – analysing OMOP Data
Once OMOP data is findable and accessible, researchers and clinicians need to be able to make use of it to draw conclusions, make accurate cohort comparisons and study patient journeys.
Working with raw OMOP can be a challenge. Multiple dictionaries require the use of databases and complex queries and while optimised for query performance, analysis of OMOP data can be challenging.
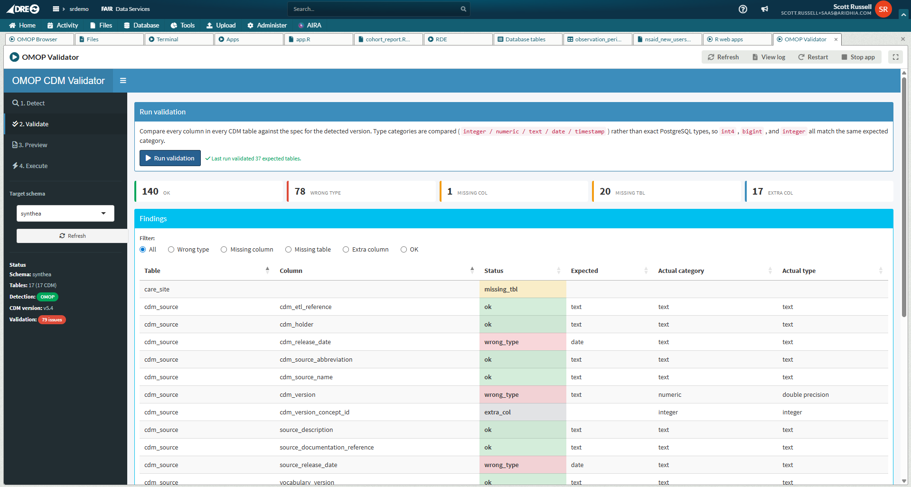
For users importing an OMOP dataset directly into the workspace, rather than via FAIR, an OMOP Validation tool is available. This tool compares the database tables with the expected metadata of the stated CDM version and determines any discrepancies. For example, incorrect field types. The tool will then optionally correct the field types in the database.
For quick browsing, analysis and reporting on an OMOP dataset, the workspace OMOP Browser tool is available. It runs as a single web application inside any Aridhia DRE workspace and connects directly to the workspace PostgreSQL database where the OMOP tables sit.
From a single screen the researcher can pick one or more OMOP schemas in the workspace. Using a comprehensive dynamic and data aware concept browser the user can explore available tables and concept counts, and assemble a cohort by adding inclusion and exclusion criteria against the standard OMOP domains. Venn-diagram visualisations and per schema counts can be used to identify overlapping domains and concepts. The following screenshots shows the user browsing two OMOP datasets with a visual representation of the overlaps in the Diagnoses and Conditions domain.

Once a cohort is built the tool generates the SQL, displays the result, and offers an attrition waterfall showing how each criterion narrowed the population. Users can save two cohorts for side by side analysis and comparison.
The tool provides analyses that researchers would otherwise need separate scripts or development environment to perform including:
- Baseline characterisation
- Table 1
- Kaplan-Meier
- Competing-risks survival curves
- Incidence rates with confidence intervals
- Multivariate Cox regression with diagnostic checks
- Treatment pathway summaries
- Cohort-to-cohort comparison with propensity score matching
Each cohort can be exported in a number of ways, from a new database schema and tables or exported CSVs for more detailed analysis in further embedded applications such as R or Jupyter Lab. Or a detailed R Markdown report that can be used to create a Word document in the workspace that can be dynamically updated in line with the data.
This document can be viewed, edited and reviewed collaboratively directly in the workspace using the embedded Collabora integration. Keeping all analysis, reporting and collaboration entirely within the secure confines of the workspace. Also, the tool will provide reusable R scripts for each piece of analysis, that can be copied and reused and re-run in the embedded R Development Environment.


If you would like to know more about the DRE and how we support our existing customers use of OMOP datasets, please don’t hesitate to get in touch.